RC Circuits

In this lab, we will observe the behavior of an RC circuit in response to a square wave signal.
We will also measure the time constant of this RC circuit, \(\tau=RC\).Hoveroverthese!
- 1 Function Generator
- 1 Oscilloscope
- 1 Component Board
- 7 Banana Cables
- 6 Alligator Clips
- Record data in this Google Sheets data table
An RC circuit consists of a resistor connected to a capacitor. There may also be a fixed power supply, depending on whether the capacitor is being charged or discharged.1
In this lab, rather than using a power supply to charge and discharge the capacitor, we will be using an input of a square wave voltage, which oscillates between some voltage \(V_0\) and \(0\). This will repeatedly charge the capacitor one way, then discharge it, with currents passing through the resistor each time.
We will denote the input voltage from the function generator as \(V_{FG}(t)\), the voltage across the capacitor as \(V_C(t)\), and the voltage across the resistor as \(V_R(t)\).
We treat "positive" as from the high side of the function generator to the low side, which implies (by Kirchhoff's Voltage Law):
$$V_{FG}(t)=V_R(t)+V_C(t)$$We also know that \(V_R(t)=I(t)R\) (Ohm's law) and \(V_C(t)=Q(t)/C\) (definition of capacitance).
Although the details of amplitudes are slightly different than a purely discharging capacitor, one still observes an exponential decay to the equilibrium voltage, with the same time constant:
$$\tau=RC$$The "equilibrium" state of an RC circuit is determined by when there is no current (because if there is current, the charge is changing). This means that the resistor should always equilibrate to zero voltage (by Ohm's law), whereas the capacitor should equilibrate to the voltage that the power supply (here, function generator) is providing.
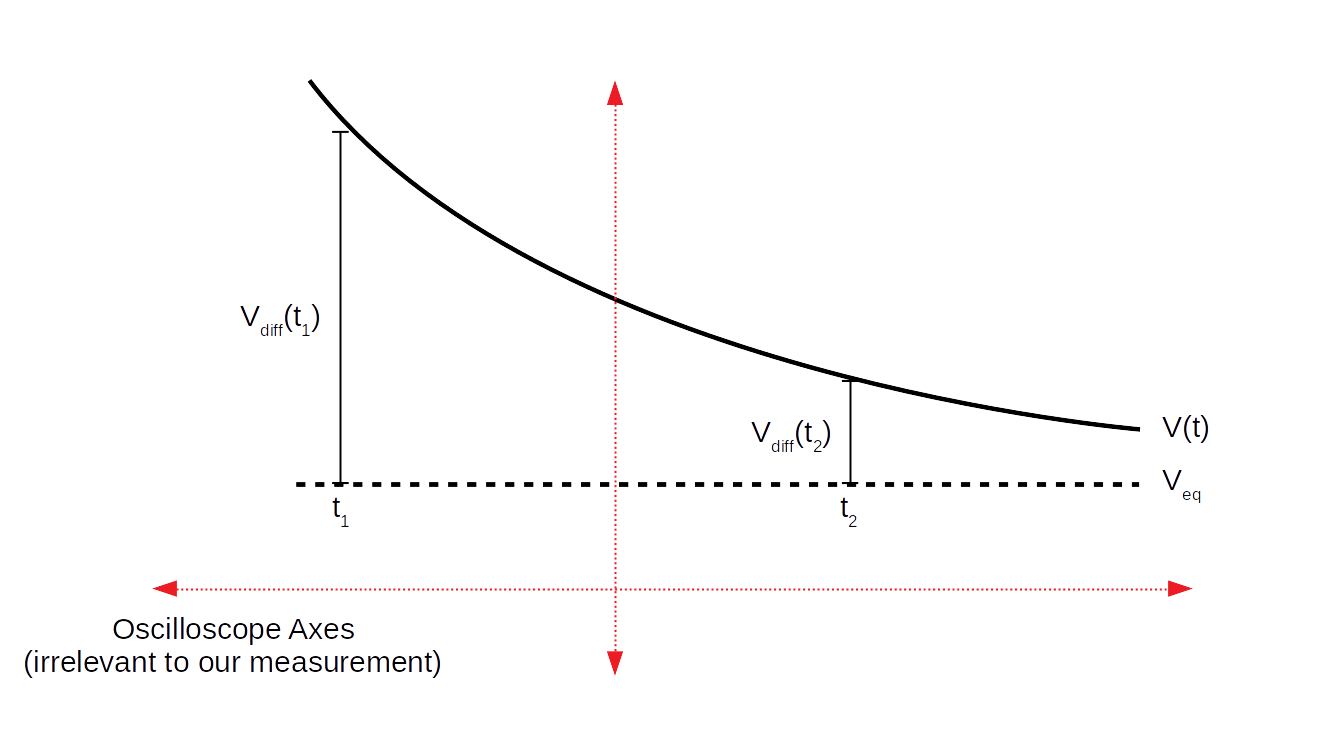
When we actually make the plot of voltage (on either component) vs. time, we will observe (for a single "pulse" of the square wave) a decay that looks roughly like the following (potentially mirrored vertically):

We will make measurements, for both the capacitor and the resistor, of the difference between the voltage across the component and the equilibrium voltage across the component, denoted above by \(V_{diff}(t)\).
Then, for both the resistor and the capacitor, we expect the relationship (with some initial voltage \(V_i\)):
$$V_{diff}(t)=V_ie^{-t/\tau}\label{decay}$$There is a practical issue with this from our perspective, however: this is a nonlinear relationship, so our plotting tool cannot infer \(\tau\) from a slope!
Therefore, we apply a trick: we make a log-linear plot. By taking a logarithm of both sides of \eqref{decay}, we can reduce this to the equation:
$$\ln(V_{diff}(t))=-t/\tau+\ln(V_i)$$This means that if we plot \(\ln(V_{diff})\) vs. \(t\), we will get a linear plot (with intercept), and can infer \(\tau\) from the slope. Problem solved!1
Part I: Voltage Across the Capacitor
First, identify the resistor and the capacitor you use in this lab:1 you will use the 1kΩ resistor, and the capacitor has a capacitance of 0.1μF. Record these quantities on your data sheet, taking a 10% uncertainty in each.
Note in this lab we are using an unusual port on the function generator: the one that says TTL (or SYNC, depending on function generator), instead of the usual "50Ω" port. If the adaptor is not attached to this port, change it to this port.2
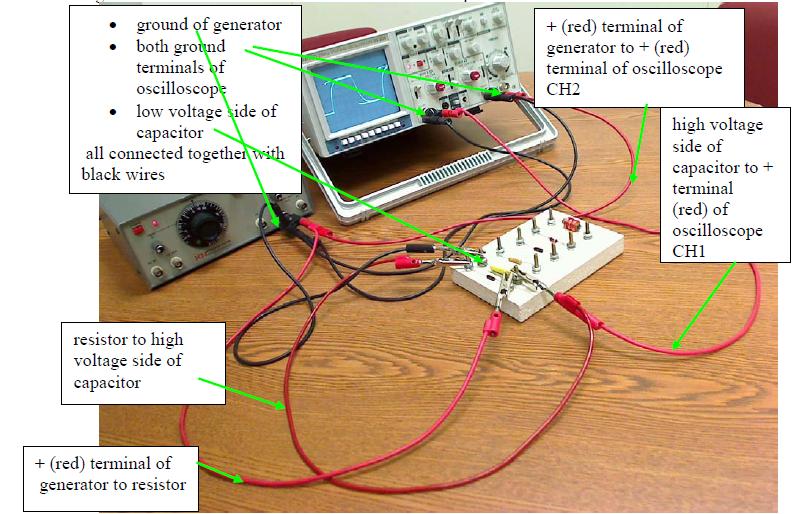
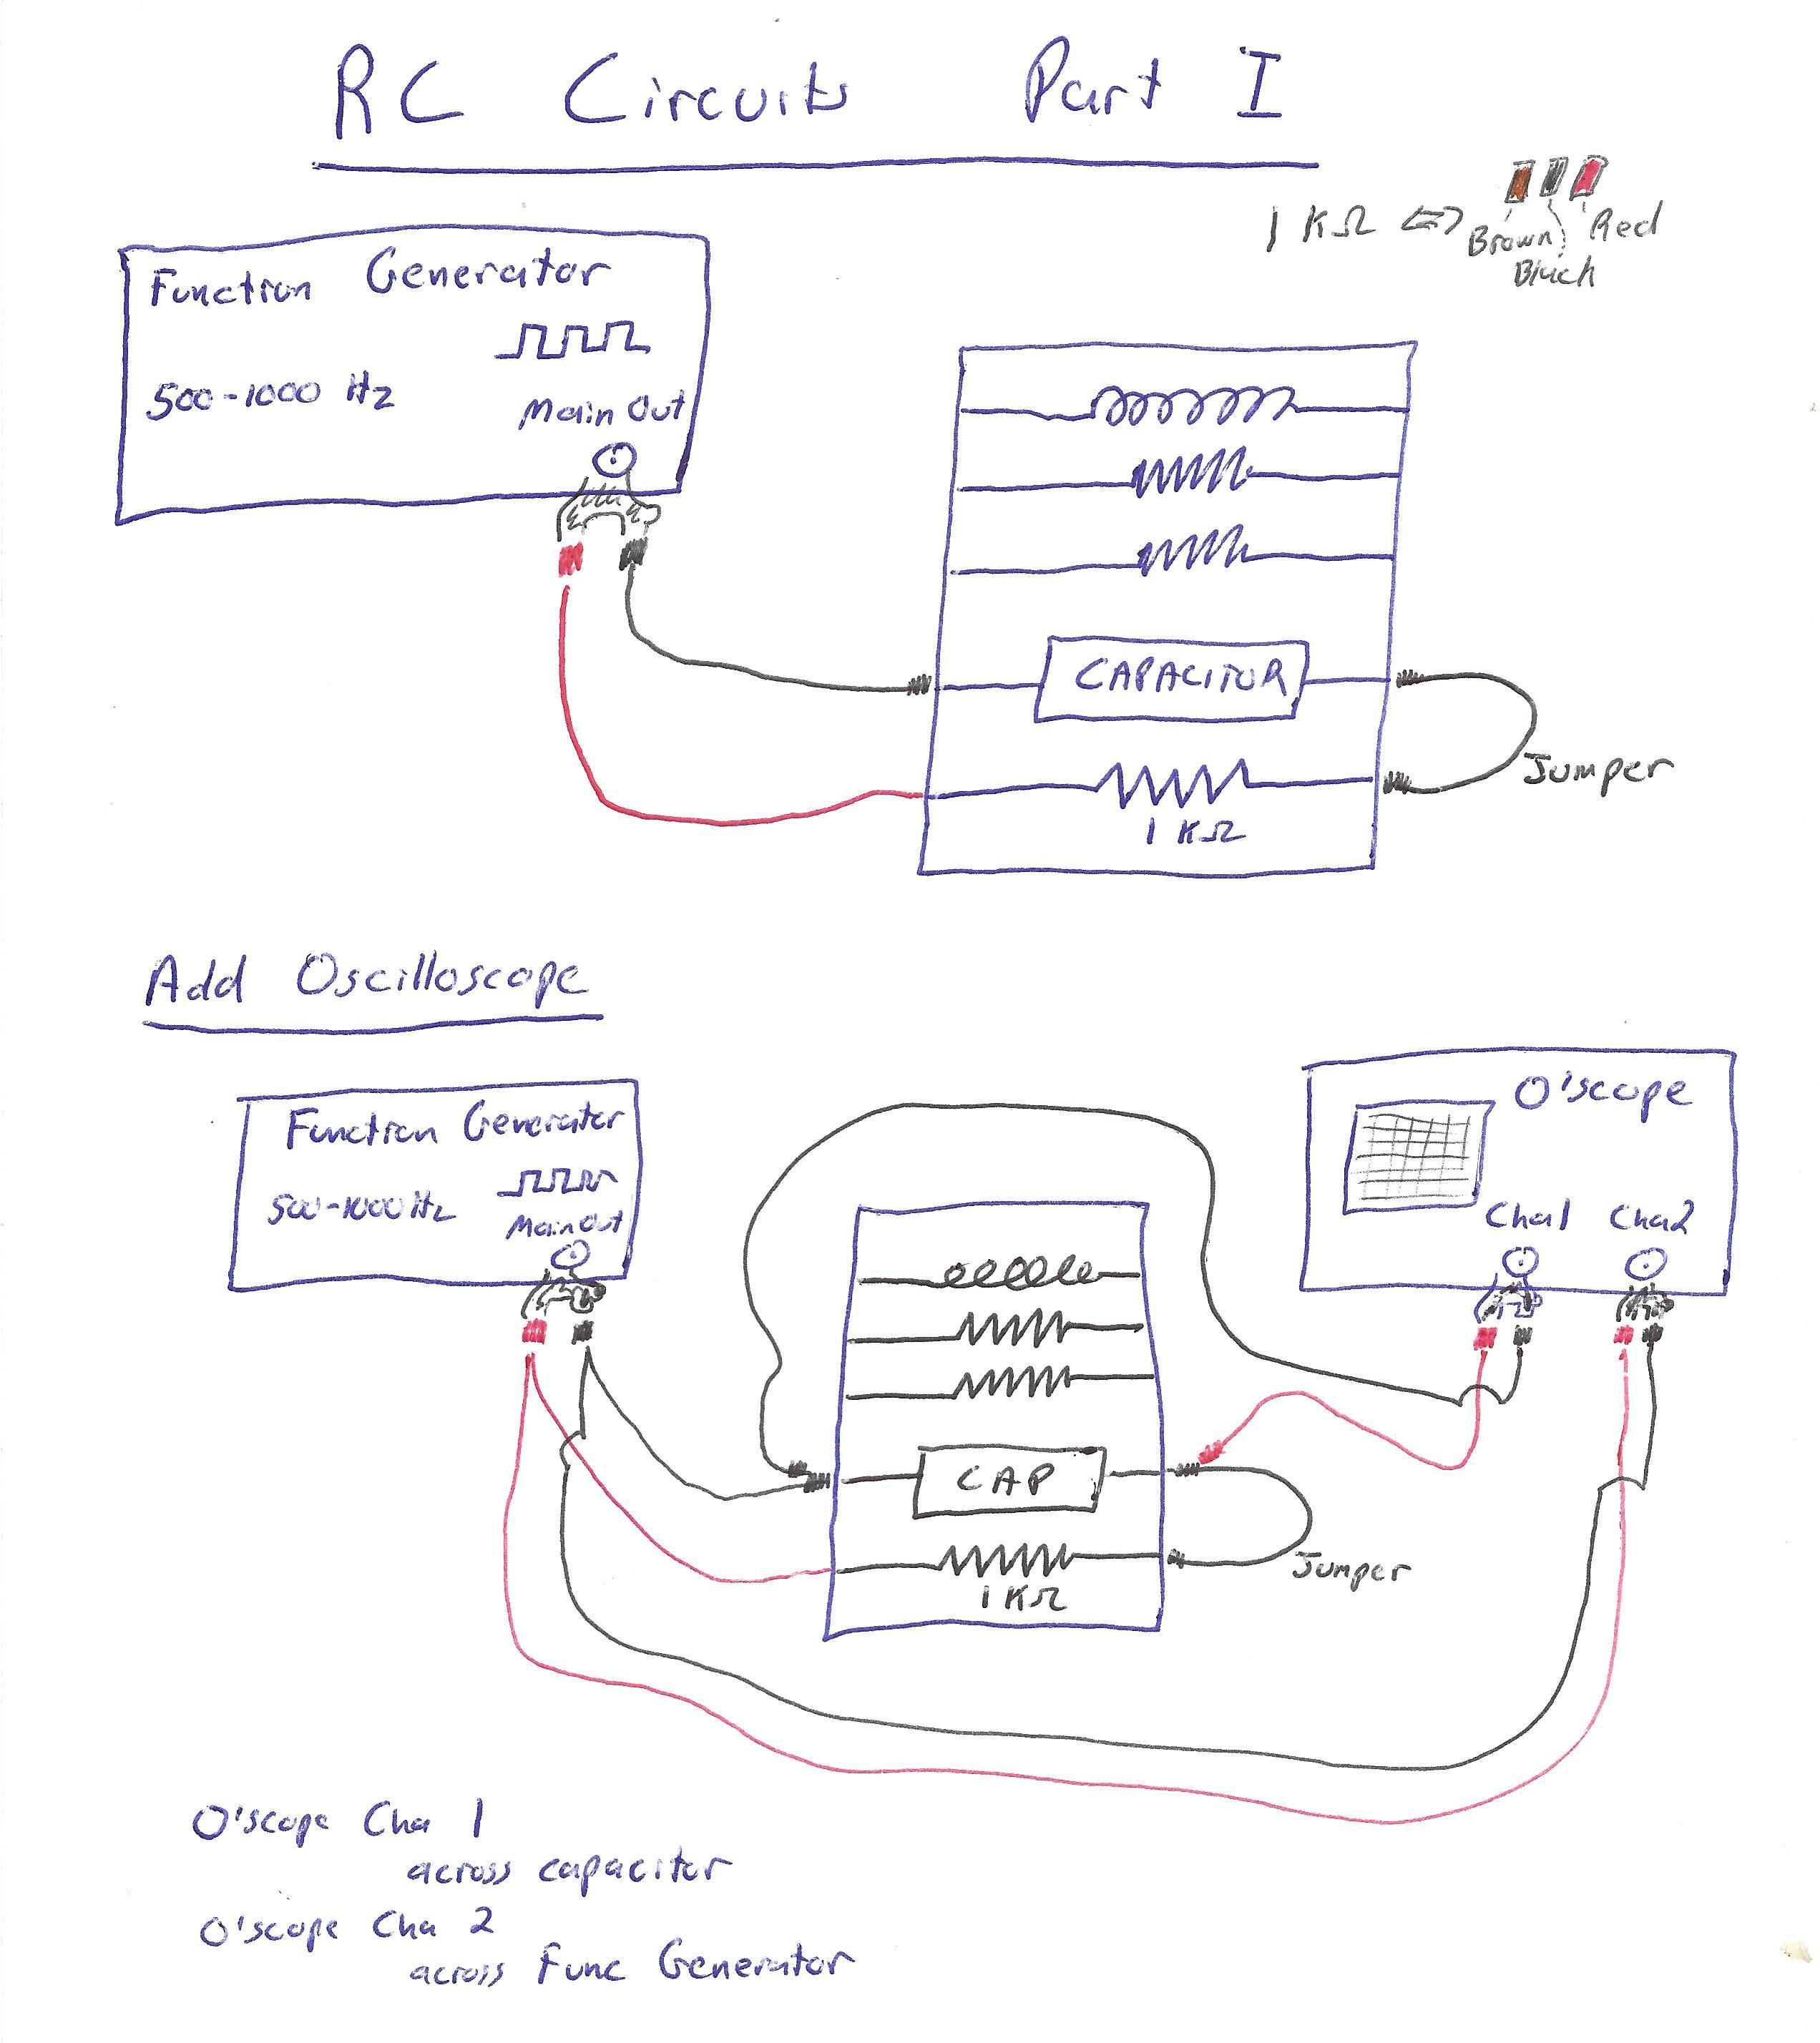
Next, wire up your circuit like the diagram below:2

Click here for step-by-step instructions for setting up your circuit for Part I.
Assuming you are starting with no wires connected:
- Begin by wiring a red wire from the red terminal on the function generator to the right side of the 1kΩ resistor.
- Connect a wire from the left side of the 1kΩ resistor to the left side of the capacitor.
- Connect a black wire from the right side of the capacitor to the black terminal on the function generator.
You should now have a loop that goes from your function generator, through the resistor, then the capacitor, back to the function generator.
- Connect a red wire from the red terminal on the function generator to the red terminal on CH2 of the oscilloscope.
- Connect a black wire from the black terminal on the function generator to the black terminal on CH2 of the oscilloscope.
You should now have made a second loop that runs through from your function generator to your oscilloscope CH2 and back again.
- Connect a red wire from the left-hand side of your capacitor to the red terminal on CH1 of the oscilloscope.
- Connect a black wire from the right-hand side of your capacitor to the black terminal on CH1 of the oscilloscope.
You should now have made a loop like the first one, except it runs through the oscilloscope CH1 port instead of the capacitor. This completes the necessary wiring for this part.
Now, turn on your function generator, and make a square wave of around 300Hz. Set the oscilloscope SOURCE and VERT MODE to CH2, and set the TRIGGER LEVEL a bit to the right of vertical, TIME/DIV to 1ms, and everything else to default settings.3 Then, adjust the INTENSITY, FOCUS, TIME/DIV, VOLTS/DIV [for CH2!], and POSITION knobs until you get a nice visible square wave, of which you can see a few periods. (Recall what it looked like in the Oscilloscope lab - you want something simliar!)
Then, set VERT MODE to DUAL (which shows you the "square wave" of the function generator and the "exponential decays" of the capacitor), and adjust your CH1 VOLTS/DIV and POS to be able to see that wave as well. Adjust the two waves' vertical positions so that their centers align. Having the VOLTS/DIV be the same for both is advisable for the sake of intuiting what is going on.
On the provided sketch paper, make a sketch of the oscilloscope screen, with all appropriate accoutrements (see below, or recall what you did on the Oscilloscope lab).
Now: adjust your TIME/DIV to focus on one "segment" (it should take up most of the screen). Keep shrinking the TIME/DIV until the decay takes at least half the screen to become "approximately" the equilibrium voltage.
Now, measure \(V_{diff}(t)\) (see background) for the capacitor for at least six different times, and record these voltages along with the corresponding times. You can neglect uncertainty on these measurements, but be sure to convert to physical units using the VOLTS/DIV and TIME/DIV settings you are using.
Part II: Voltage Across the Resistor
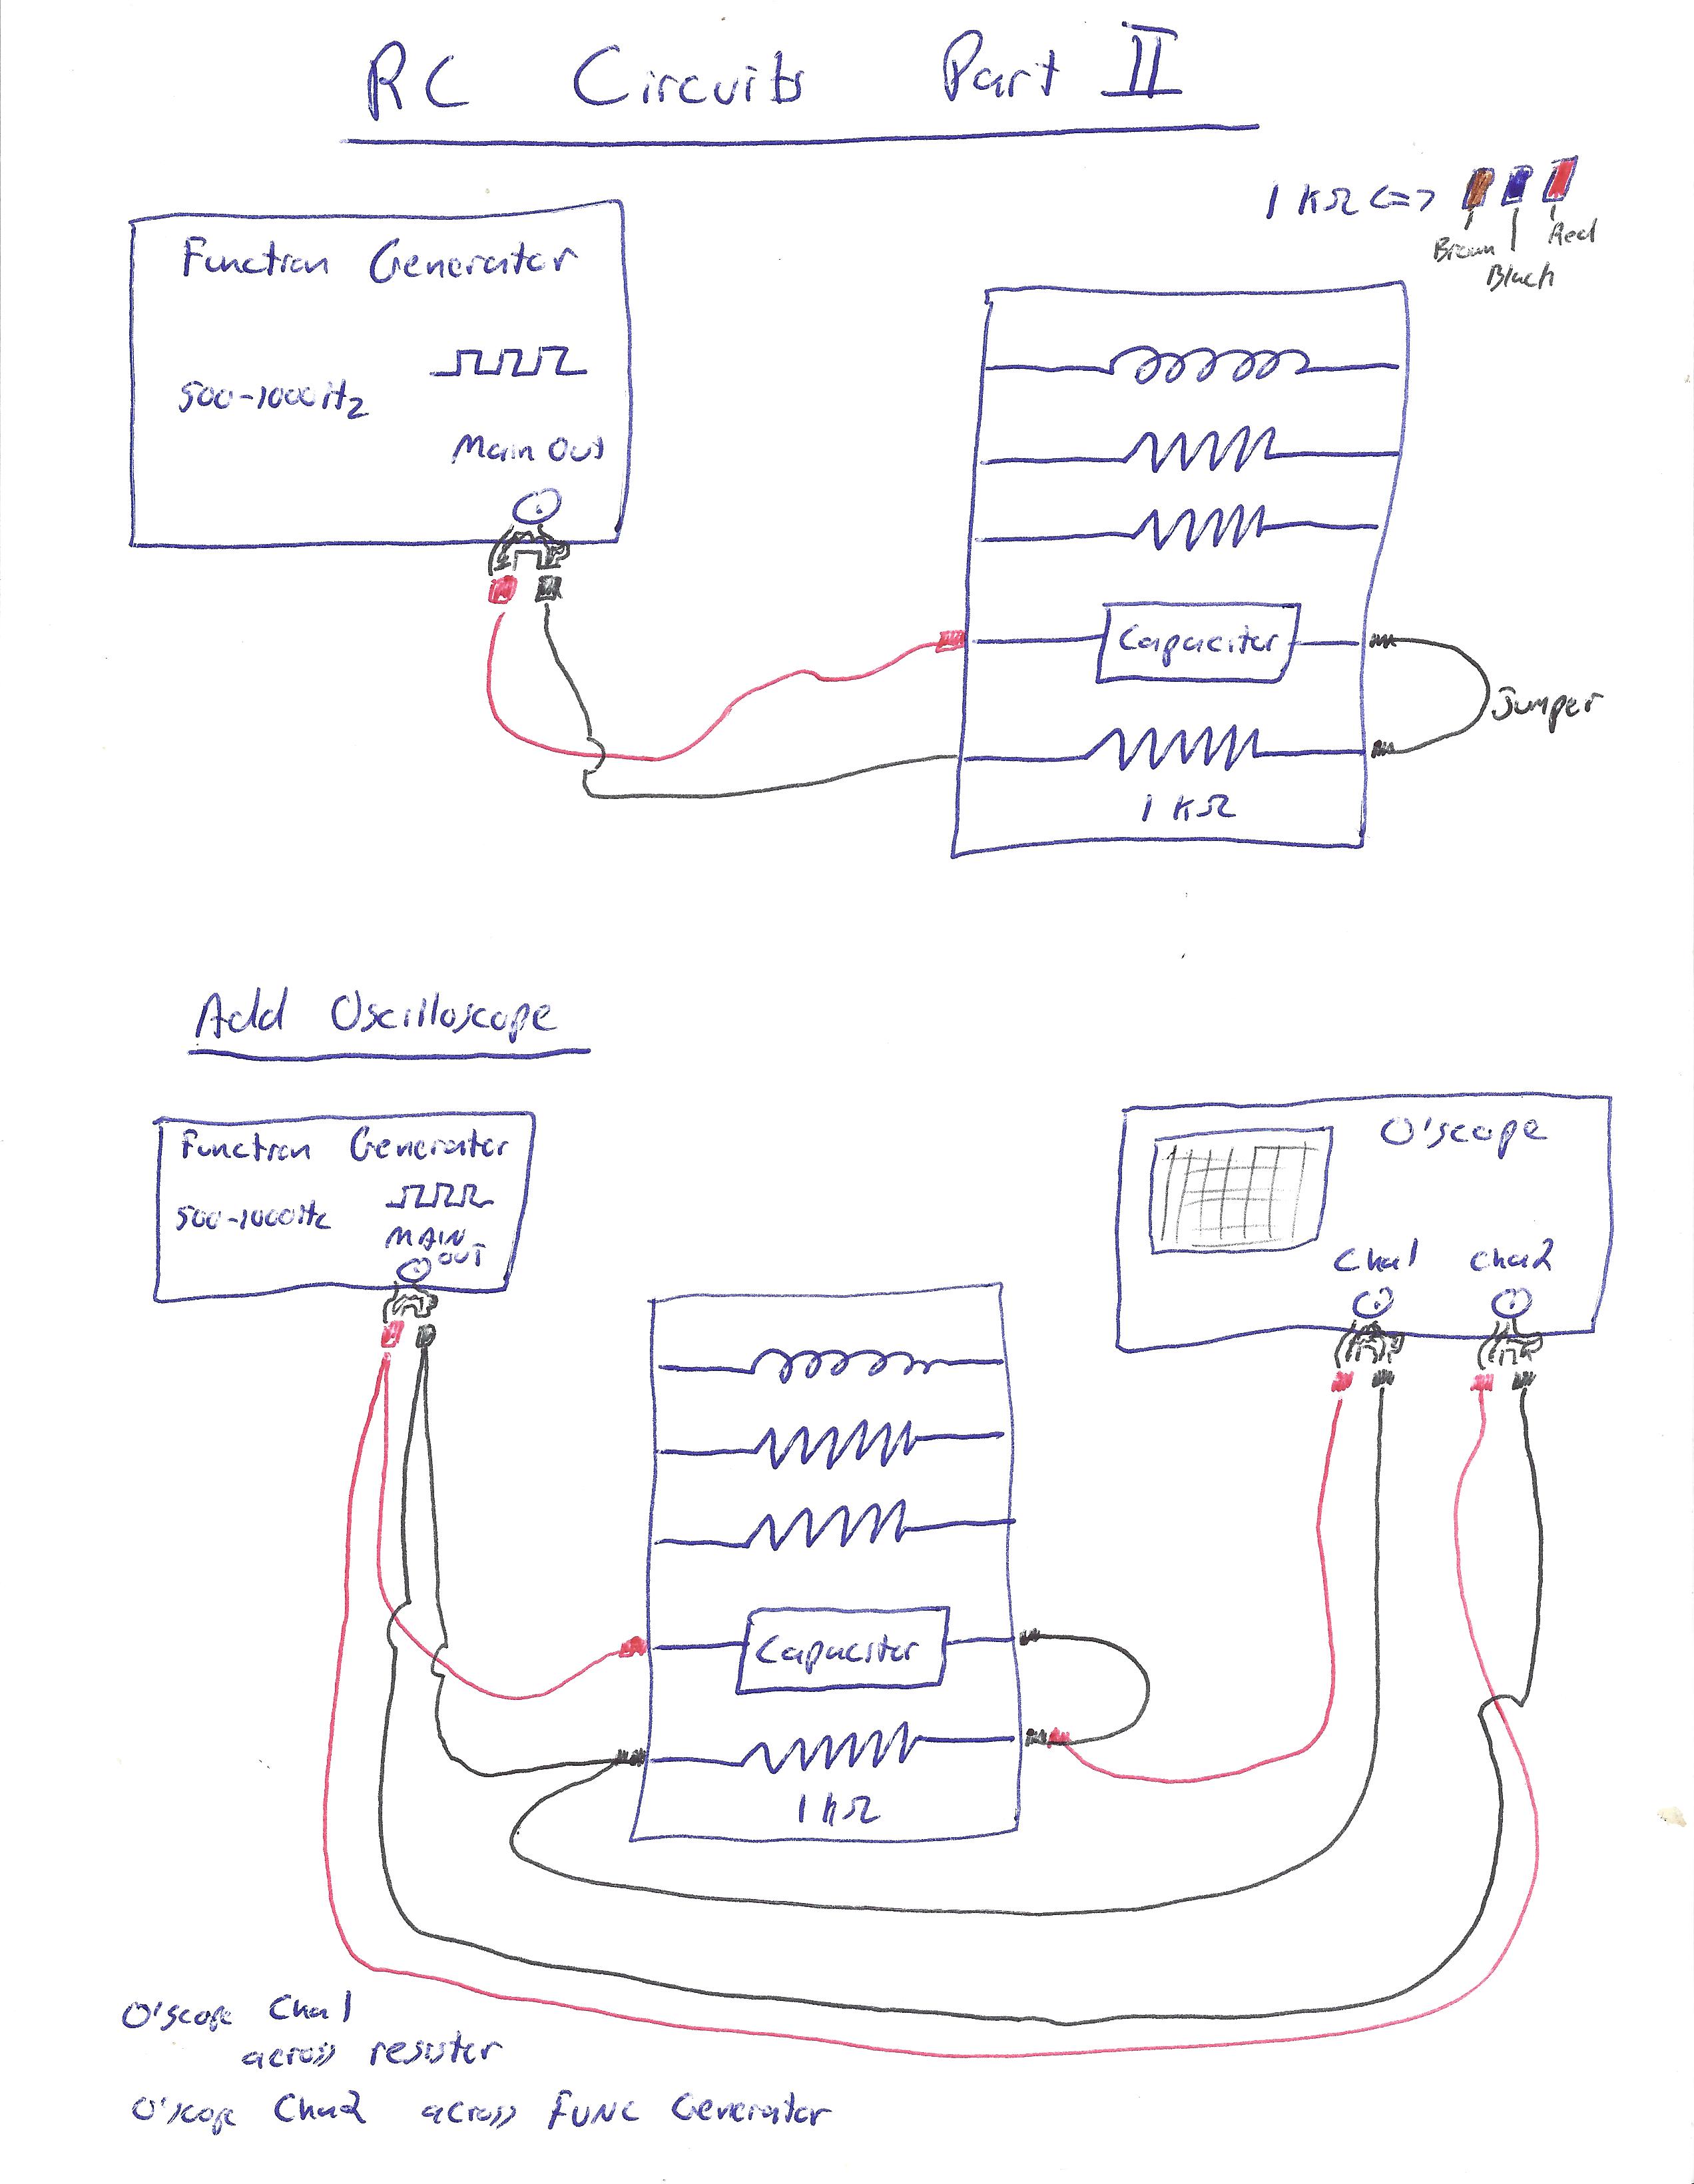
Now, swap the positions of the resistor and capacitor in your circuit. This should lead to a circuit wired as shown below:

Click here for step-by-step instructions for setting up your circuit (from scratch) for Part II.
Assuming you are starting with no wires connected:
- Begin by wiring a red wire from the red terminal on the function generator to the right side of the capacitor.
- Connect a wire from the left side of the capacitor to the left side of the 1kΩ resistor.
- Connect a black wire from the right side of the 1kΩ resistor to the black terminal on the function generator.
You should now have a loop that goes from your function generator, through the resistor, then the capacitor, back to the function generator.
- Connect a red wire from the red terminal on the function generator to the red terminal on CH2 of the oscilloscope.
- Connect a black wire from the black terminal on the function generator to the black terminal on CH2 of the oscilloscope.
You should now have made a second loop that runs through from your function generator to your oscilloscope CH2 and back again.
- Connect a red wire from the left-hand side of your 1kΩ resistor to the red terminal on CH1 of the oscilloscope.
- Connect a black wire from the right-hand side of your 1kΩ resistor to the black terminal on CH1 of the oscilloscope.
You should now have made a loop like the first one, except it runs through the oscilloscope CH1 port instead of the 1kΩ resistor. This completes the necessary wiring for this part.
Now, repeat the analysis of the previous part:
- Get the square wave set up so that you can easily see it.
- Add in the resistor voltage, and get it on the screen reasonably as well.
- Fit both on the screen (ideally with the same vertical scale), and make a sketch of your oscilloscope screen.
- Set your timescale to focus on one segment (you may set your VERT MODE to CH1 for this part, to get rid of the square wave, which is no longer necessary).
- Make at least six measurements of \(V_\text{diff}(t)\) and \(t\) for the resistor.
Oscilloscope Sketches
In this lab, you will make two oscilloscope sketches. Each of them should have the following:
- A title for the plot
- Labelled and numbered axes, with units3
- A sketch of the curve that is visible on your screen (of course), drawn to the best of your ability
- Labels indicating which curve is CH1 and which curve is CH2
Using the theoretical resistance and capacitance, calculate the time constant \(\tau\) and propagate uncertainty.
Then, both for the capacitor and for the resistor:
- For each voltage, take \(\ln(V_{diff})\). You do not need units on this quantity.
- Make a plot of \(\ln(V_{diff})\) vs. \(t\). You do not need units on your y-axis or any error bars.
- From the slope of that plot, extract a measurement of \(\tau\). Propagate uncertainty.
Finally, answer the question in the data sheet about agreement with expectation for each part.
Your TA will ask you to answer some of the following questions (they will tell you which ones to answer):
Experimental Questions:
- There are additional sources of resistance in the circuit beyond the resistor (contact resistance, etc.). What impact would these additional resistances have on our measurement for the time constant from the oscilloscope (relative to the theoretical one calculated using the resistor's resistance)?
- In this lab, we assume the oscilloscope has infinite resistance (as a voltmeter). In fact, it has some finite resistance (say, 1MΩ). For Part II, considering the oscilloscope wired in parallel with the resistor, what impact would this have on our measurement of the time constant of the oscilloscope (relative to the theoretical one calculated using the resistor's resistance)?
Theoretical Questions:
- What are the equilibrium voltages of the capacitor and the resistor when the function generator voltage is \(V_0\)? Is this what you observe on your oscilloscope sketches?
- What are the equilibrium voltages of the capacitor and the resistor when the function generator voltage is \(0\)? Is this what you observe on your oscilloscope sketches?
- What are the voltages on the capacitor and resistor right after the function generator changes from \(0\) to \(V_0\)? Is this what you observe on your oscilloscope sketches?
- What are the voltages on the capacitor and resistor right after the function generator changes from \(V_0\) to \(0\)? Is this what you observe on your oscilloscope sketches?
For Further Thought:
- In this lab, we assume the oscilloscope has infinite resistance (as a voltmeter). In fact, it has some finite resistance (say, 1MΩ). What impact would this have on our circuit in part I (where it is wired in parallel with the capacitor)?
Guide to Uncertainty Propagation & Error Analysis (Quick Reference)
Hovering over these bubbles will make a footnote pop up. Gray footnotes are citations and links to outside references.
Blue footnotes are discussions of general physics material that would break up the flow of explanation to include directly. These can be important subtleties, advanced material, historical asides, hints for questions, etc.
Yellow footnotes are details about experimental procedure or analysis. These can be reminders about how to use equipment, explanations of how to get good results, troubleshooting tips, or clarifications on details of frequent confusion.
For more information about RC Circuits, see KJF Ch. 23.7.
For a review of how to do this on different function generators, see our Notes on the Function Generators.
For a review of basic settings, see our Notes on the Oscilloscope, or look back at the Oscilloscope Lab.
These components may be in different positions than in the diagrams below. Ignore their positions, just make sure you're wiring together the right components.
Don't try to be clever here: the oscilloscope is slightly more complicated than a voltmeter, and can't be placed at an arbitrary point in your circuit like a voltmeter can. In particular, the black wires are grounded to the case, thus implicitly always together. This means that placing one of them halfway through your circuit will ground two different parts of your circuit, which will totally throw off your results.
If you use different vertical axis scales for the different channels, put one set of numbers on your x-axis and another on your right, and label which of those is CH1 and which is CH2.
There's a rather subtle issue surrounding the units on \(\ln(V)\). Really, you can't take a logarithm of a quantity with units. The ideal quantity to take would be \(\ln(V/V_i)\), but we don't actually know \(V_i\). What we "really" do is measure \(\ln(V/(1\text{V}))\), which is a the log of a dimensionless quantity (thus also dimensionless), and similarly \(\ln(V_i/(1\text{V}))\) on the other side. Since changing units on \(V\) just lead to a different intercept, we ignore them, since we're only concerned about the slope.
This ensures that the voltage jumps from \(0\) to \(V_0\) instead of from \(-V_0\) to \(V_0\). (The latter works too, but adds some subtleties that this way avoids.)