Oscilloscopes
The oscilloscope is a very widely used laboratory instrument frequently used to give a visual display of time-varying voltages. While some oscilloscopes now use liquid-crystal displays (LCDs), many (including the Elenco DS-203) still use a CRT. Cathode-ray tubes were invented more than a century ago, and you will be most familiar with them from older televisions and computer monitors. Roughly, a CRT works as follows. Within an evacuated tube (see Fig. 2), a heated filament (much like the filament of an electric lightbulb) and a series of accelerating and focusing electrodes serve as the source of a well-collimated beam of electrons; this assembly is called an electron gun. These electrons are shot towards the phosphor-coated, inside front surface (i.e., the viewing screen) of the tube, causing a visible spot to appear where the electrons strike the surface. Also within the CRT are pairs of metal plates which, when an electric field is established between one or the other pair, can deflect the electron beam horizontally or vertically. This moves the visible spot to any desired point on the screen.
In Fig. 2 note that vertical and horizontal refer, respectively, to the direction of the electric field between the plates and, therefore, in which plane the electrons are being deflected. The actual plates are, of course, perpendicular to the direction of the deflecting electric field. The oscilloscope can be thought of as a voltmeter that plots voltage (vertical axis) vs. time (horizontal axis). The information given by the oscilloscope is read from the front screen much as you would read information from a graph. Here, the x-axis (horizontal) plots time and the y-axis (vertical) plots voltage. Figure 2 A schematic of a Cathode Ray Tube
When reading the oscilloscope you need to think about how to define where the origin (0,0) lies on the screen. On the graphs you've drawn previously the origin has obviously been where your two axes intersect, but with the oscilloscope the position of a trace on the screen can be adjusted and the “zero point― of a particular variable needs to be defined.
You can define the origin (0,0) to be at any intersection on the screen and read the signal with respect to that origin. For some experiments in this course you will want to consider the origin as the lower left corner of the screen. For others you may want to choose the center of the screen. For this lab is it most convenient to consider the time (horizontal) zero point to be at the first horizontal mark on the left side of the screen and the voltage (vertical) zero point to be at the central line going across the screen. On your sketches of measured signals it is important to show where your origin is and what is the scale of each box so that you can correctly interpret your measurements.Notice that the oscilloscope screen has evenly spaced horizontal and vertical lines that form a grid over which the signal will be displayed. The scale of each axis is important for telling you the voltage and time duration of your signal. The TIME/DIV knob and the VOLT/DIV knob on the control panel set, respectively, the horizontal and vertical scales, and you can (and will!) be adjusting them to observe different “signals― (voltage vs. time variations) well. The setting for each of these knobs tells you how much time or voltage each large division represents.
For example, if the TIME/DIV knob is set to 1 microSecond (μs) , then the horizontal side of a box represents 1 μs. Since there are five tick marks in each box, each tick mark on the horizontal axis represents 1/5 as much, 0.2 μs. The same principle applies to voltage. If VOLT/DIV is set at 10 V, each vertical side of a box represents 10 V, and each small tick mark represents 1/5 as much, 2 V.
NOTE! The TIME/DIV and VOLT/DIV knobs tell you the value of an entire box, not the small tick marks inside the box!

A digital oscilloscope uses an analog-to-digital converter (ADC) to sample voltages and render a display of voltage as a function of time. Since the displays of phones, computer monitors or other device screens are designed for humans, the re-fresh rate is typically much slower than the rate at which the signal is digitized. This means that there is much in the design and logic of the devices which is hidden from the user.
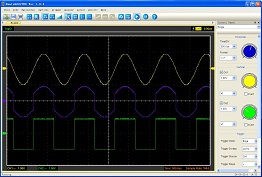
The result, however, is to have an interface which is much like that of an analog oscilloscope. The pc software for this Hantek oscilloscope is designed to be especially familiar to people (like this author) who learned on analog 'scopes. Along with menus and task buttons, across the top of the screen, there are knobs for Horizontal Sweep, Vertical and Trigger on the side, where they have been placed on oscilloscopes since the 1950's.
The menus across the top of the screen and task buttons have redundant functions. The table below gives the functions of the task buttons.
| Control | Purpose |
|---|---|
| Load | display a saved waveform |
| Save | save the current waveform |
| no purpose, really | |
| Math | options to conbine signals |
| Ref | options to compare to a reference signal |
| Vector | display signal as line |
| Dots | display signal as points |
| Intensity | vary grid and signal brightness |
| No Cursor | turn off measurement cursors |
| # Cursors | both vertical and horizontal cursors |
| || Vert | vertical cursors, to measure in time |
| = Horiz | horizontal cursors, to measure in voltage |
| AC AND DC (Ch 1) | switch to DC position |
| 3 Blurred buttons | functions we do not have |
| ?? | |
| ?? | |
| Run | digitize and update display |
| Pause | stop digitizing and hold display |
| ?? |

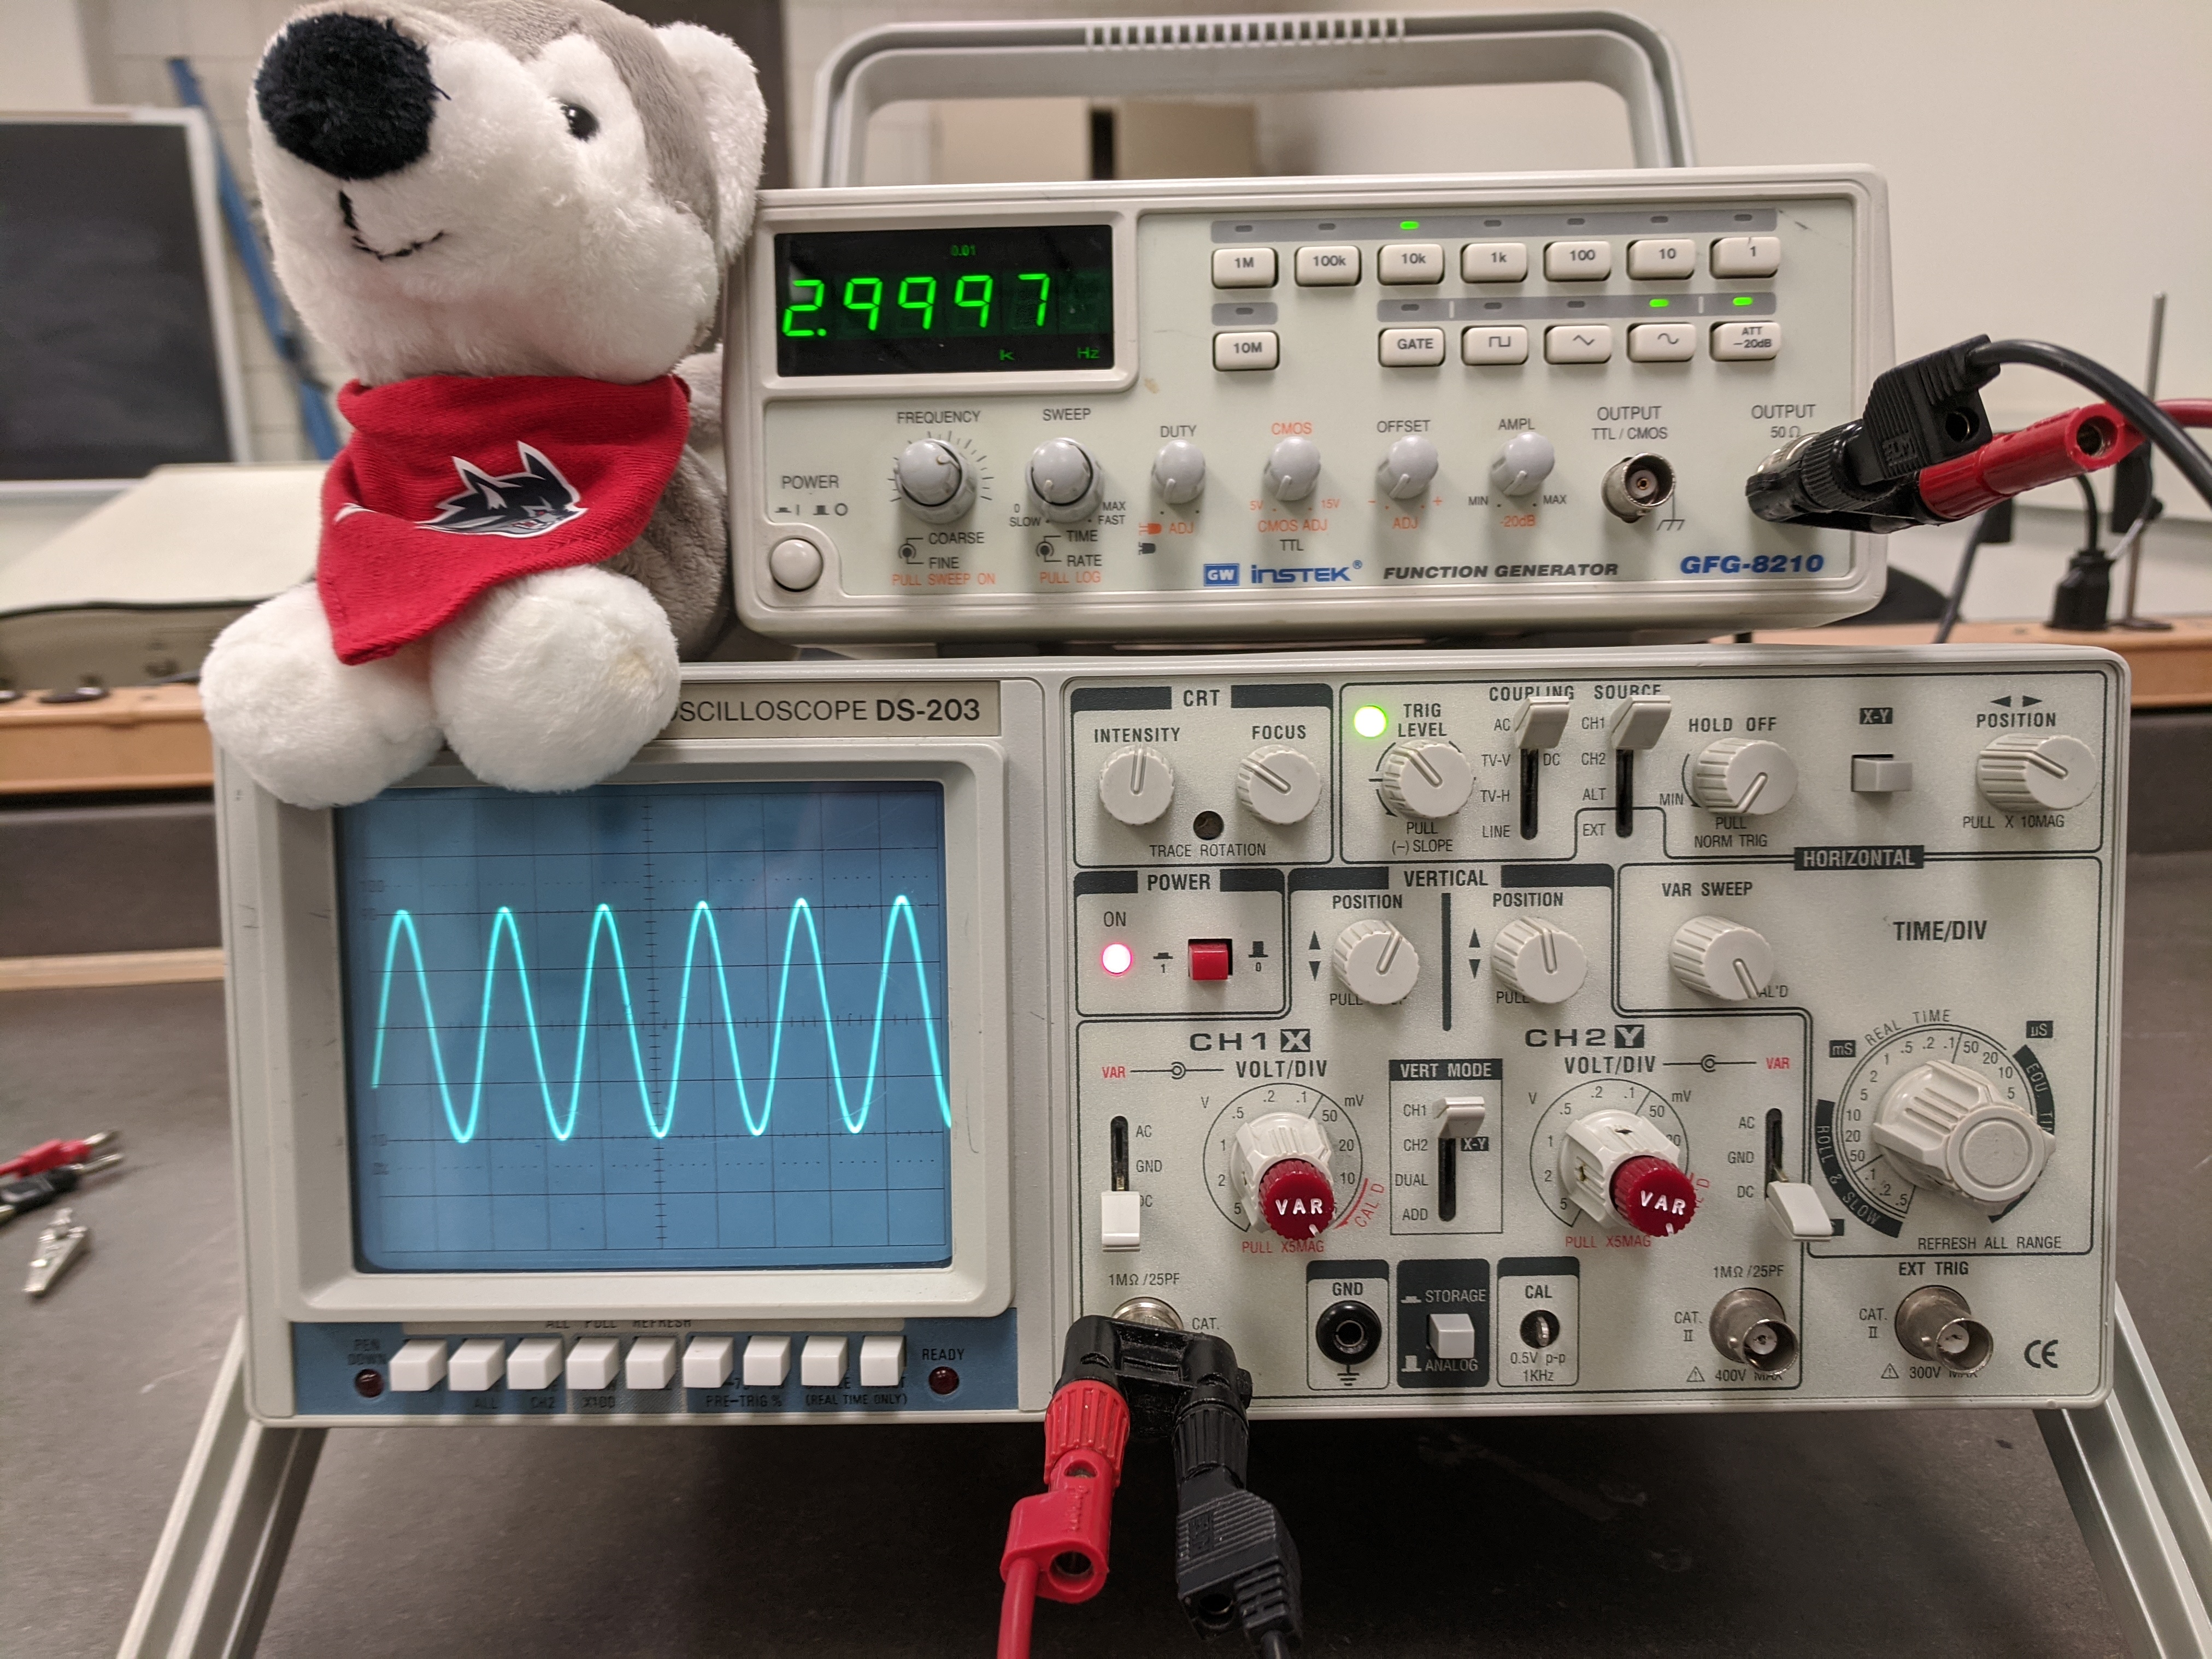
The Elenco DS-203 is an analog, Cathode Ray Tube (CRT) oscilloscope with 20 MHz bandwidth and 1 milliVolt sensitivity. It also has 2 channels of digital storage each of which can hold 2048 8-bit words, sampled at up to 10 MegaSamples per second.
The following instructions create a good starting point for any measurement using the oscilloscope. For any specific measurement, you will adapt the settings as needed. With the oscilloscope directly in front of you, set the controls as follows:
The white buttons below the display screen on the left should all be in the out position. The controls to the right of the screen should be adjusted as given below (cw means clockwise):
| Control | Setting |
|---|---|
| INTENSITY: | mid-range (line pointing up) |
| FOCUS: | mid-range |
| TRIGGER LEVEL: | mid-range |
| COUPLING: | AC position |
| SOURCE: | CH 1 position |
| HOLDOFF: | MIN (ccw) position, knob pushed in |
| XY: | button to the OUT position |
| POS: | mid-range |
| POWER: | button to the OUT position |
| POS ^ (Ch 1): | mid-range, knob pushed in |
| POS ^ (Ch 2): | mid-range, knob pushed in |
| VAR SWEEP: | calibrated (cw) position |
| AC AND DC (Ch 1) | switch to DC position |
| CH 1 knob: | set to 1 V(olt), VAR knob in CAL (cw) position |
| VERT MODE: | CH 1 position |
| CH 2 knob: | set to 1 V(olt), VAR knob in CAL (cw) position |
| AC GND DC (Ch 2): | set to DC position |
| TIME/DIV knob: | set to 0.1 (s) position |
| STORAGE/ ANALOG: | button to the OUT (ANALOG) position |