
Resistance and Ohm's law
The purpose of this lab is to verify experimentally the factors that affect the electrical resistance of metals, observe the relationship between voltage across and current through electrical circuit elements. You will verify Ohm’s Law by measuring voltage and current for a resistor.
- LabQuest 3
- Resistivity rod set
- Instrumentation amplifier
- Current probe
- Differential voltage probe
- Vernier Circuit board
Georg Simon Ohm discovered the relationship among current, voltage and resistance in an electrical circuit. Ohm’s law states that the electrical current through a resistor is proportional to the voltage across the resistor: $$ V = IR $$ Where \(V\) is voltage and \(I\) is current through a resistor with resistance \(R\). This law works for devices made of metals and simple semiconductors, and when the law works, we call the device “Ohmic”. Other kinds of electrical components may not be Ohmic and in these cases it does not make much sense to talk about resistance. In non-Ohmic devices \( R=V/I \) may depend on factors such as the temperature (as it does in light bulbs), the direction of current flow (for example, in diodes), or the light intensity falling on the component (light sensitive diodes). In this lab we will work with resistors and materials that are Ohmic.
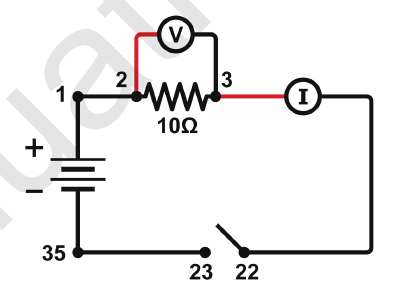
In the first part of the experiment you will use the differential voltage probe (voltmeter) to measure \(V\), the voltage drop across the component, and the current probe (ammeter) to measure \(I\), the current flow through the component. Keep in mind that ammeters must be connected in series in circuits, while voltmeters must be connected in parallel across the circuit component. Figure 1 shows the proper setup.
Technical note: Voltmeters take up a small amount of current from the circuit being tested. This current is determined by the resistance between the two leads of the voltmeter. You want this current to be as small as possible. Thus “good” voltmeters have a large resistance compared to \(R\). Since the voltmeter is in parallel to the resistor, the current through R is essentially the same as if the voltmeter is disconnected, and only very small fraction of the current flows through the voltmeter. The differential voltage probe you use has a much larger resistance (10MΩ) than the resistance to be measured, \(R\).
In an ideal case a “good” ammeter has a very small resistance compared to \(R\), which allows current to easily pass through the ammeter and be measured. The current probe has a resistance of 0.1Ω, which is very small in comparison to \(R\).
- Connect the current probe to channel 1 and the differential voltage probe to channel 2 of the LabQuest3.
- Connect together the two voltage leads (red and black) of the differential voltage probe and click zero.
- Leave the leads of the current probe open and click zero.
- Connect the batteries (power supply), 10Ω resistor, and the current probe as shown in Figure. Note: The numbers in Figure 1 refer to the numbered terminals on circuit board. Do not connect the voltage probes yet.
- Set Switch 1, SW1, located bellow the battery holder on the circuit board to 3V.
- Press the red button (between terminals 22 and 23). The current probe should read a non-zero current.
- Connect the voltage probes as in Figure 1 and press the red button again. If the current or the voltage is negative, make sure the red leads from the current and differential voltage probes are toward the positive terminal of the power supply, as shown in the Figure.
- Record the values of current, voltage in the respective value of resistance in a table, such as Table 1. Note: You need to keep pushing the switch in order to close the circuit and the current can flow.
- Change the resistor using the terminals in the circuit board shown in Table 1.
- Calculate voltage over current and plot \(R\) vs. \(V/I\).
- In this measurement, far the largest source of uncertainty is coming from the fact that the nominal values of the resistances (\(R\), the number written on the circuit board) are actually different from the real values \(V/I\), the values you calculated). Therefore it is not necessary to calculate the error of \(V/I\).
| Terminals in Circuit Board | Resistance R in Ohms | Current (A) | Voltage (V) | V/I |
|---|---|---|---|---|
| 2-3 | 10 | |||
| 6-7 | 51 | |||
| 10-11 | 68 |
Questions
Answer the following questions:
- Q1. - What is the slope of \(R \) vs. \(V/I\)? What is the uncertainty in the slope? Based on what you measured and plotted what is the relative error of the nominal value of the resistors?
- Q2. - Explain why the ammeter needs to be connected in series and the voltmeter in parallel.
Metals at ambient temperature are generally excellent conductors of electricity, but they are not perfect. The finite resistance of a metallic conductor results in energy dissipation (the conversion of electric energy into heat), and that is why a wire conducting an electric current gets hot sometimes. The resistance of a metal rod depends on its length, cross section and on the material it is made of. In this part of the lab you will study the relationship between these factors and the electrical resistance of the rod.
Procedure
- Connect the current probe to channel 1 and the Instrumentation amplifier to channel 2 of the LabQuest2.
- Set the range of the instrumentational amplifier to ±20mV. Connect together the two voltage leads (red and black) and click zero.
- Select one of the rods to measure and record the material it is made of (Aluminum or Copper are not recommended, because they are good conductors and more difficult to measure.)
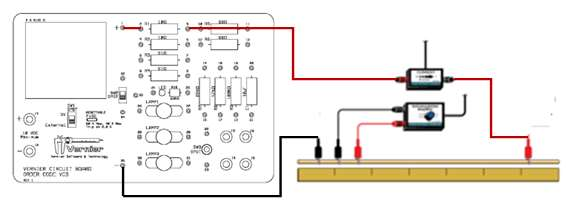
- Connect the batteries (power supply), 10Ω resistor, wires, rod, current probe and Instrumentation amplifier as shown in Figure 2. The leads from the current probe and from the circuit board should be close to the ends of the rod.
- Set the initial distance between the Instrumentation amplifier leads at 5cm (see Table 1) and measure the voltage.
- Move the red lead 5 cm further from the black lead and measure voltage.
- Repeat step 5 four more times. Record the value of the voltage in Table 2.
Evaluate the Data
- Plot the measured voltage \(V\) vs. Length \(L\)
| Trial | Voltage V in Volts | Length L in meters |
|---|---|---|
| 1 | 0.05 | |
| 2 | 0.10 | |
| 3 | 0.15 | |
| 4 | 0.20 | |
| 5 | 0.25 | |
| 6 | 0.30 |
- Q3a. - According to the graph, what is the relationship between voltage and the length of the metal?
- Q3b. - What is the relationship between resistance and the length of the material? Remember: Resistance is proportional to the voltage (\(R\) α \(V\)), therefore, if you conclude that voltage is proportional to the length (\(V\) α \(L\)) from previous question, then, the resistance is proportional to the length (\(R\) α \(L\)).
- Take one rod of brass and connect the circuit as you did in the previous procedure (Figure 2).
- Connect the red lead of the instrumentation amplifier 25 cm from the black lead. Record the voltage, current and the diameter of the rod in Table 2. The error for voltage and current is approximately 1% of the reading on LabQuest, as indicated by the product specifications.
- Take another brass rod with a different diameter and repeat step 2. Do this with all different diameters of the brass rods (4 in total). Keeping the 25cm between the leads of the differential amplifier is crucial for this part. Keep it constant every time you change rods. We will assume that you can keep the distance with a 1mm accuracy.
Evaluate the Data
- Calculate the cross sectional area A of the rod using the diameter, A = πD /4. Calculate the inverse of the cross sectional area, 1/A, as well and record them in Table 4.
- Calculate the resistance \(R\) and its error \( \Delta R \) from the voltage and the current. For the error, use an equation for the case of division of two quantities from the Guide to estimating uncertainty: $$ \frac{\Delta R}{R} = \sqrt{{(\frac{\Delta I}{I})}^2 + {(\frac{\Delta V}{V})}^2} $$
- Plot the resistance vs. the inverse of cross-sectional area (\(1/A\)).
- Since the diameter (and therefore the cross sectional area) is known very accurately, the error of the Length/Area comes entirely from the error of the length. The relative error of the two quantities is the same; use this to determine the absolute error of the Length/Area.
- To evaluate the resistivity, take the values from TABLE 4, and graph resistance (y-axis) vs. length/area (x-axis). Enter the values of the errors for both quantities and determine the slope (resistivity, or \( \rho \)) and its uncertainty. Do not forget to use the proper units \(\Omega\)m or \(\mu\Omega\)m, where 1 \( \mu\Omega\)m = \(10^{-6}\)m )
| Trial | Voltage V in mV | Error in Voltage (mV) | Diameter (mm) | Length L (m) | Error in Length (m) | Current I in Amps | Error in Current I (A)Trial |
|---|---|---|---|---|---|---|---|
| 1 | 2.381 | 0.250 | 0.001 | ||||
| 2 | 3.175 | 0.250 | 0.001 | ||||
| 3 | 3.969 | 0.250 | 0.001 | ||||
| 4 | 4.762 | 0.250 | 0.001 |
| Trial | Area in m^2 | Inverse of Area m^(-2) | Length/Area m^(-1) | Error in Length/Area m^(-1) | Resistance Ω | Error in Resistance Ω |
|---|---|---|---|---|---|---|
| 1 | ||||||
| 2 | ||||||
| 3 | ||||||
| 4 |
Questions
Answer the following questions:- Q4. - According to the graph of R vs. 1/A, what is the relationship between resistance and the cross sectional area of the rod?
- Q5. - What is the resistivity of the material? What is the relative error of your result?Q3. - According to the graph, what is the relationship between voltage and the length of the metal? What is the relationship between resistance and the length of the material? Remember: Resistance is proportional to the voltage (R α V), therefore, if you conclude that voltage is proportional to the length (V α L) from previous question, then, the resistance is proportional to the length (R α L).
We will look at a pure metal (Copper) and four alloys. Alloys are made of a mixture of metals or metals and other elements:
- Brass: Copper and Zinc. It has a gold-like appearance and easy to work with (malleable).
- AlMgSi (labeled Aluminum here): Aluminum, Magnesium and Silicon. It is much stronger than pure Aluminum. It is used, for example, to make the skin of the aircrafts.
- Stainless steel: Iron, with at least 10% of Chromium. It is strong and does not rust like pure iron.
- Music wire: Iron, with ~1% of Carbon and some Manganese. It is very elastic, used in springs.
In order to observe if the material of the rod has an effect on the resistance, we will use the resistivity, \(\rho\), which is unique for each material (see Table 3 below).
Procedure
- Take the stainless steel rod and connect the circuit as you did in the previous procedures (follow Figure 2).
- Connect the red and black leads of the instrumentation amplifier at a distance of 25 cm. Measure the voltage.
- Take the brass rod with the same diameter as the previous rod and repeat step 2. Keep 25cm between the leads of the instrumentation amplifier. Keep this distance constant every time you change rods.
- Repeat step 2 for aluminum, music wire and copper rods. Record the value of the voltage in Table 5.
Evaluate the Data
| Metal | Voltage (mV) | Resistivity [\(\mu\)Ωm] |
|---|---|---|
| Stainless steel | 0.77 | |
| Brass | 0.080 | |
| Aluminum | 0.035 | |
| Music Wire | 0.21 | |
| Copper | 0.017 | |
- Plot the measured voltage vs. resistivity of the material.
Questions
Answer these questions:
- Q6. - According to the graph, what is the relationship between voltage and the resistivity of the material?
- Q7 - What is the relationship between resistance and the resistivity of the material? Remember: Resistance is proportional to voltage (\(R\) α \(V\)), therefore, if you conclude that voltage is proportional to the resistivity (V α \( \rho \)) from the previous question, then the resistance is also proportional to the resistivity (R α \( \rho \)).
- Q8. - In the last procedure (effect of the material), why is important to use different rods of the same diameter?
- Q9. - Why is it important to keep the distance between the red and black leads of the instrumentation amplifier at the same value (25cm) when you measure the voltage of different rods?
- Q10. - Using the information from the three previous procedures, write down the equation that relates the resistance of the rod in terms of its length, cross sectional area and electrical conductivity of the material.