Speed of Sound

Equipment
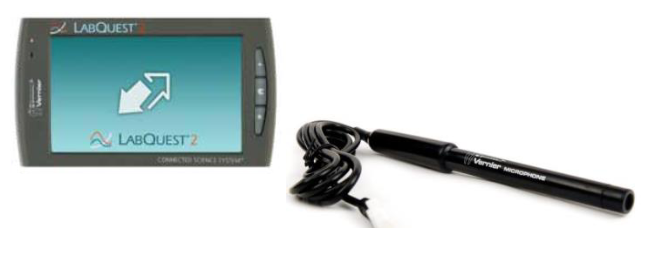
- LabQuest 2
- Vernier microphone
- 4 or 5 PVC pipes of different lengths with cap (you will have to share with other groups)
- Vernier thermometer
- Ruler
Sound waves travel very fast and measuring their speed is a technical challenge. For this experiment, we will use an echo technique over a short distance. You need a relatively fast timing system, such as the LabQuest2, to determine the speed of sound at room temperature.

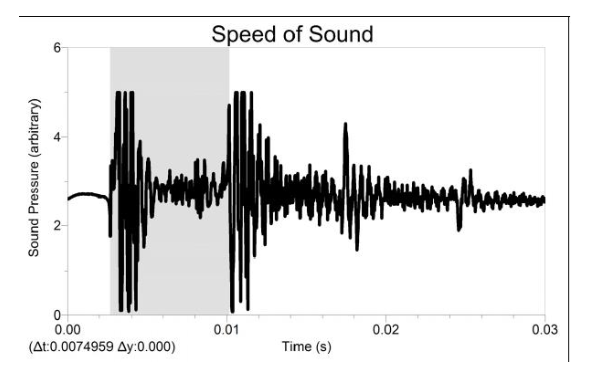
The microphone will be placed next to the opening of a hollow tube. When you make a sound by snapping your fingers or clapping next to the opening, the computer will begin collecting data. The sound reflects off the opposite end of the tube and travels back to the microphone. The LabQuest2 will display a graph showing the initial sound and the echo. As some of the sound is reflected at the open end you will also see a subsequent echo once the reflection makes another round trip to the closed end of the tube and back. By measuring the time interval between echos you will be able to determine the round trip time and calculate the speed of the sound using the kinematic equation for constant velocity:
$$v = \frac{2 L}{T} $$\(L\) is the length of the tube (you must multiply by 2 because the sound wave travels twice the length of the pipe) and \(T\) is the round trip time. The speed of sound depends on the compressibility and inertia of the medium, as well as the temperature of the medium. When a sound wave is traveling through air, its velocity is dependent upon air temperature and can be calculated using the following equation:
$$ v = (331 + 0. 6T) m/s $$where \(T\) is the temperature of the air in Celsius.
- Connect the Vernier microphone to Channel 1 of the analog interface of the LabQuest2. Use a thermometer to measure the air temperature of the classroom and record the value.
- Take one pipe and close one end using a cap. Measure and record the length of the tube. Place the microphone as close to the open end of the long pipe as possible, as shown in figure, so it can detect the initial sound and the echo. Hold the microphone as close to the center of the tube as possible.
-
Go to the meter screen and click on the right side of the screen (over mode option) and activate triggering. Select the option “is increasing across” and enter a trigger threshold of 3. This will activate the collection data at the moment you snap your fingers.
Click to begin data collection. Snap your fingers close to the microphone in the opening of the tube. This sharp sound will trigger the interface to begin collecting data. If the collection data is activated without snapping it means there is a lot of noise around the microphone (perhaps caused by your talking partners). If this is the case, then increase the trigger threshold.
The graph will resemble the figure below. The first vibration peaks belongs to the initial sound, the second is the first reflection, the third is a second reflection and so on, you might be able to see four or five vibration peaks. Repeat data collection if necessary.

- The time interval between any two successive peaks should be the round trip time interval (period) \(T\). Record the value of T and estimate its uncertainty \( \Delta T \). You can reduce the uncertainty in \(T\) by measuring the distance between several vibrations and then dividing by the appropriate number of vibrations.
- Take another pipe with a different length and repeat the previous steps in order to calculate the new value of \(T\). Do the same for a minimum of four different pipes.
| Pipe | Length L±ΔL (m) | Time T±ΔT(sec) |
|---|---|---|
| 1 | ||
| 2 | ||
| 3 | ||
| 4 | ||
| 5 |
- Make a graph of \(L\) vs \(T\) and find the slope. Is the slope of this graph the value of the speed of the sound? Use equation (1) to justify your answer.
- Find the experimental value of the speed of sound in the air and its uncertainty using the previous graph and compare it to the one you obtain by using equation (2).
Answer the following questions in your lab notebook:
- Did the values for speed of sound in air that you obtained by the two methods agree within experimental uncertainty? Justify your response and comment on sources of error.
- Suppose the temperature in the room drops 10°C, and you repeat the experiment. What would you expect to happen to the experimental value of the speed of the sound? Will it increase, decrease, or remain the same? Justify your response.
Hovering over these bubbles will make a footnote pop up. Gray footnotes are citations and links to outside references.
Blue footnotes are discussions of general physics material that would break up the flow of explanation to include directly. These can be important subtleties, advanced material, historical asides, hints for questions, etc.
Yellow footnotes are details about experimental procedure or analysis. These can be reminders about how to use equipment, explanations of how to get good results, or clarifications on details of frequent confusion.
Value is from NOAA for Latitude: 40.91597332879679, Longitude: -73.12491620370486, MSL Height: 41.0 Predicted gravity: 980269 +/- 2 milligals where a "gal" is a centimeter per second squared