Simple Harmonic Motion
Equipment
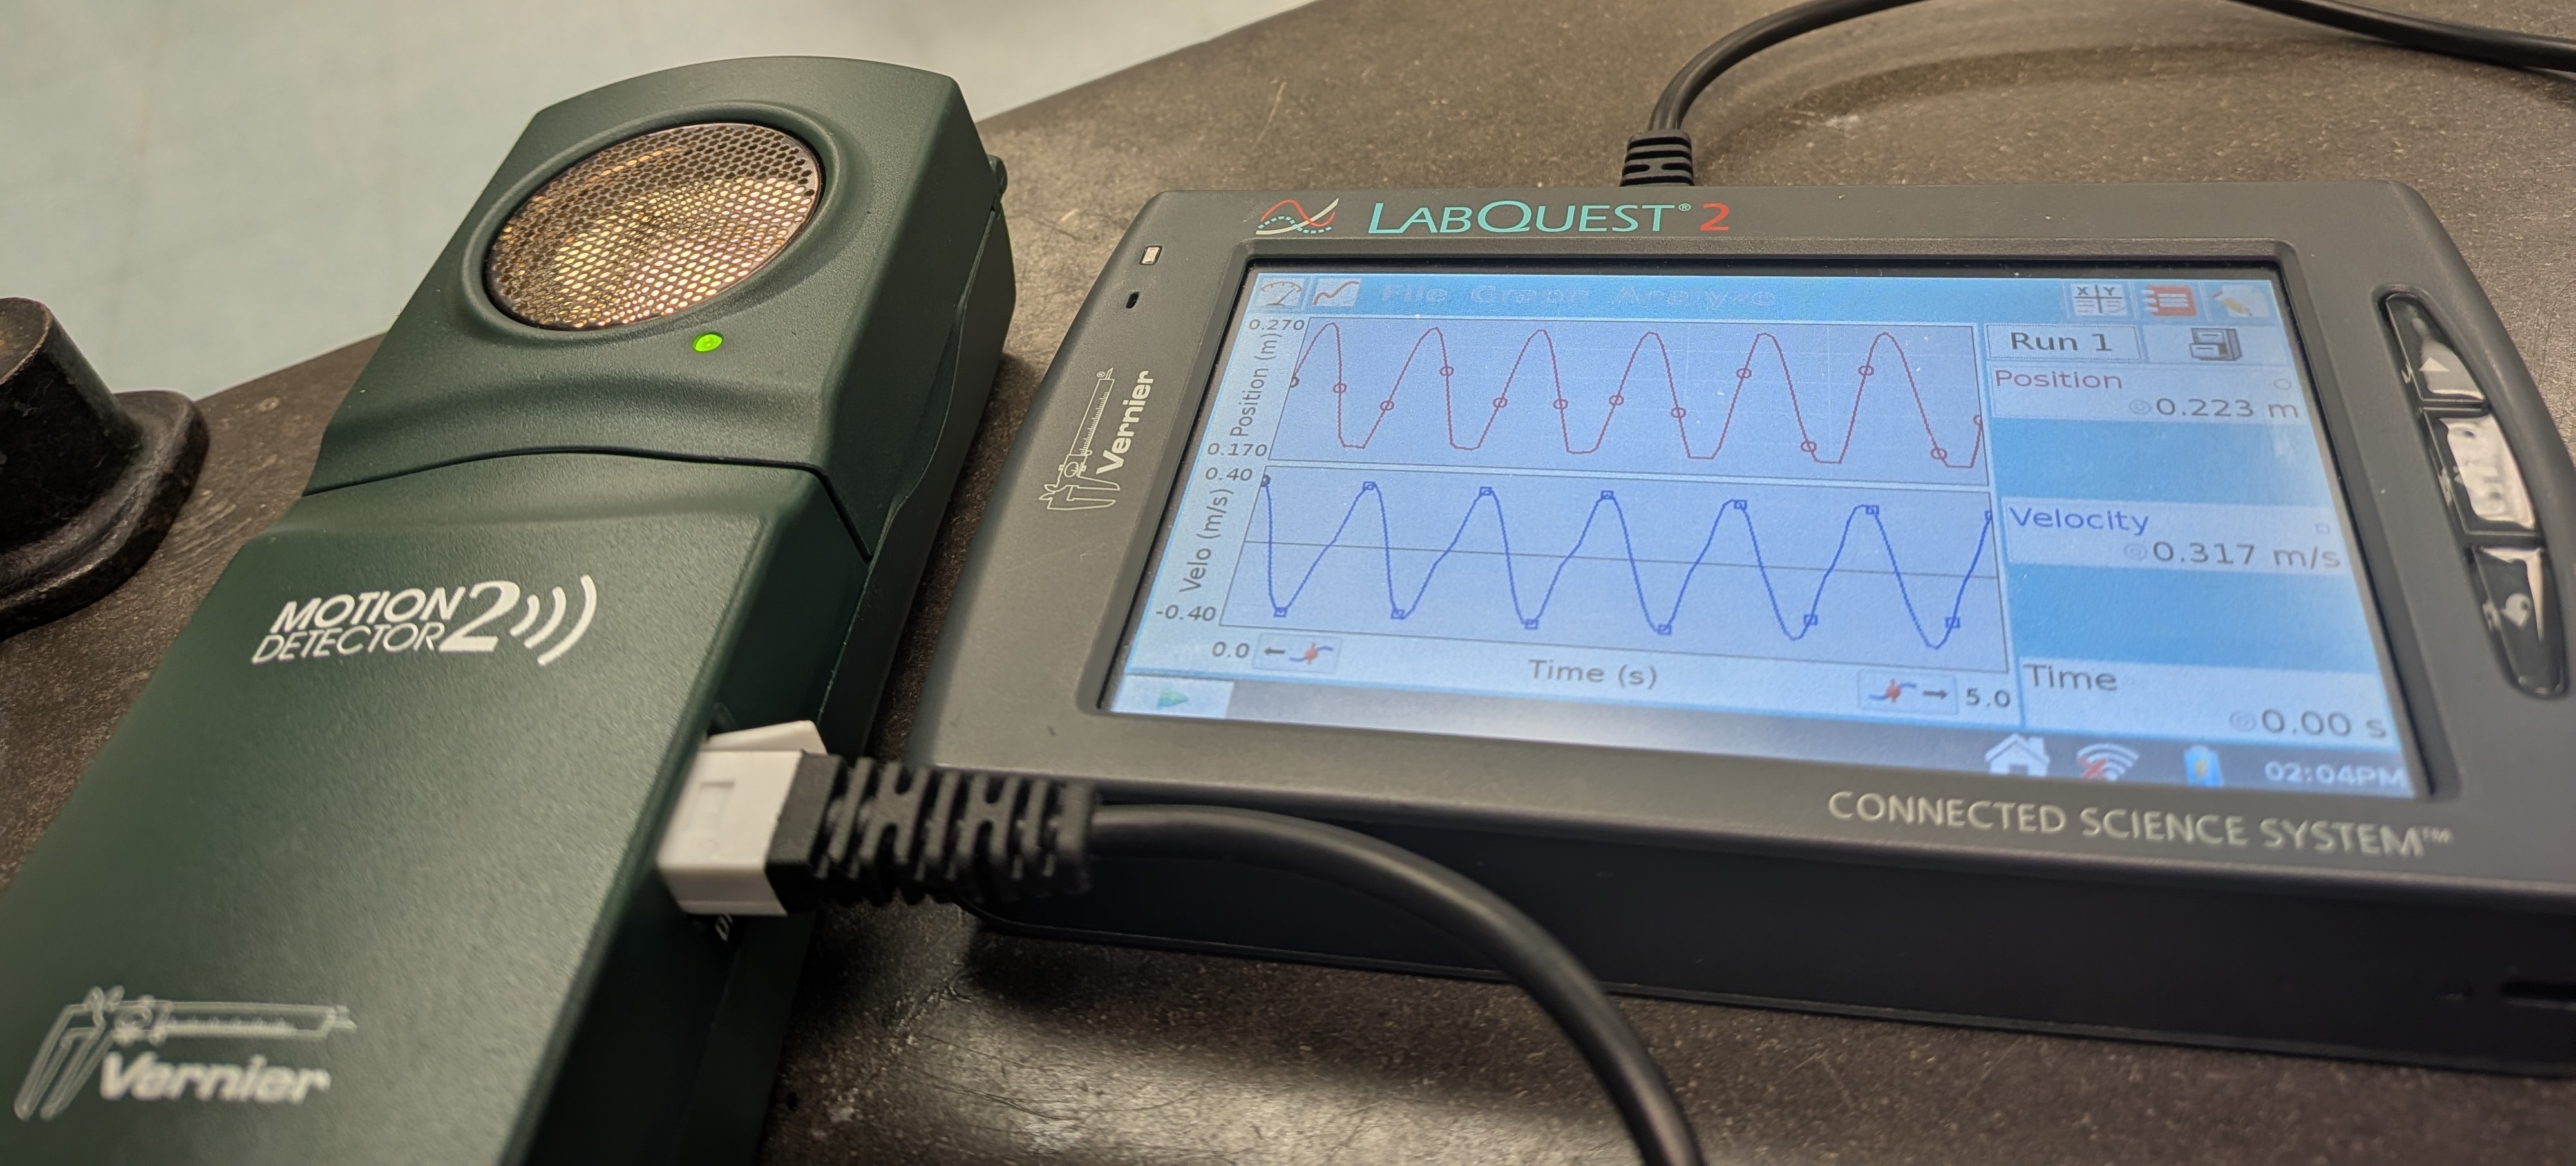
- LabQuest 2
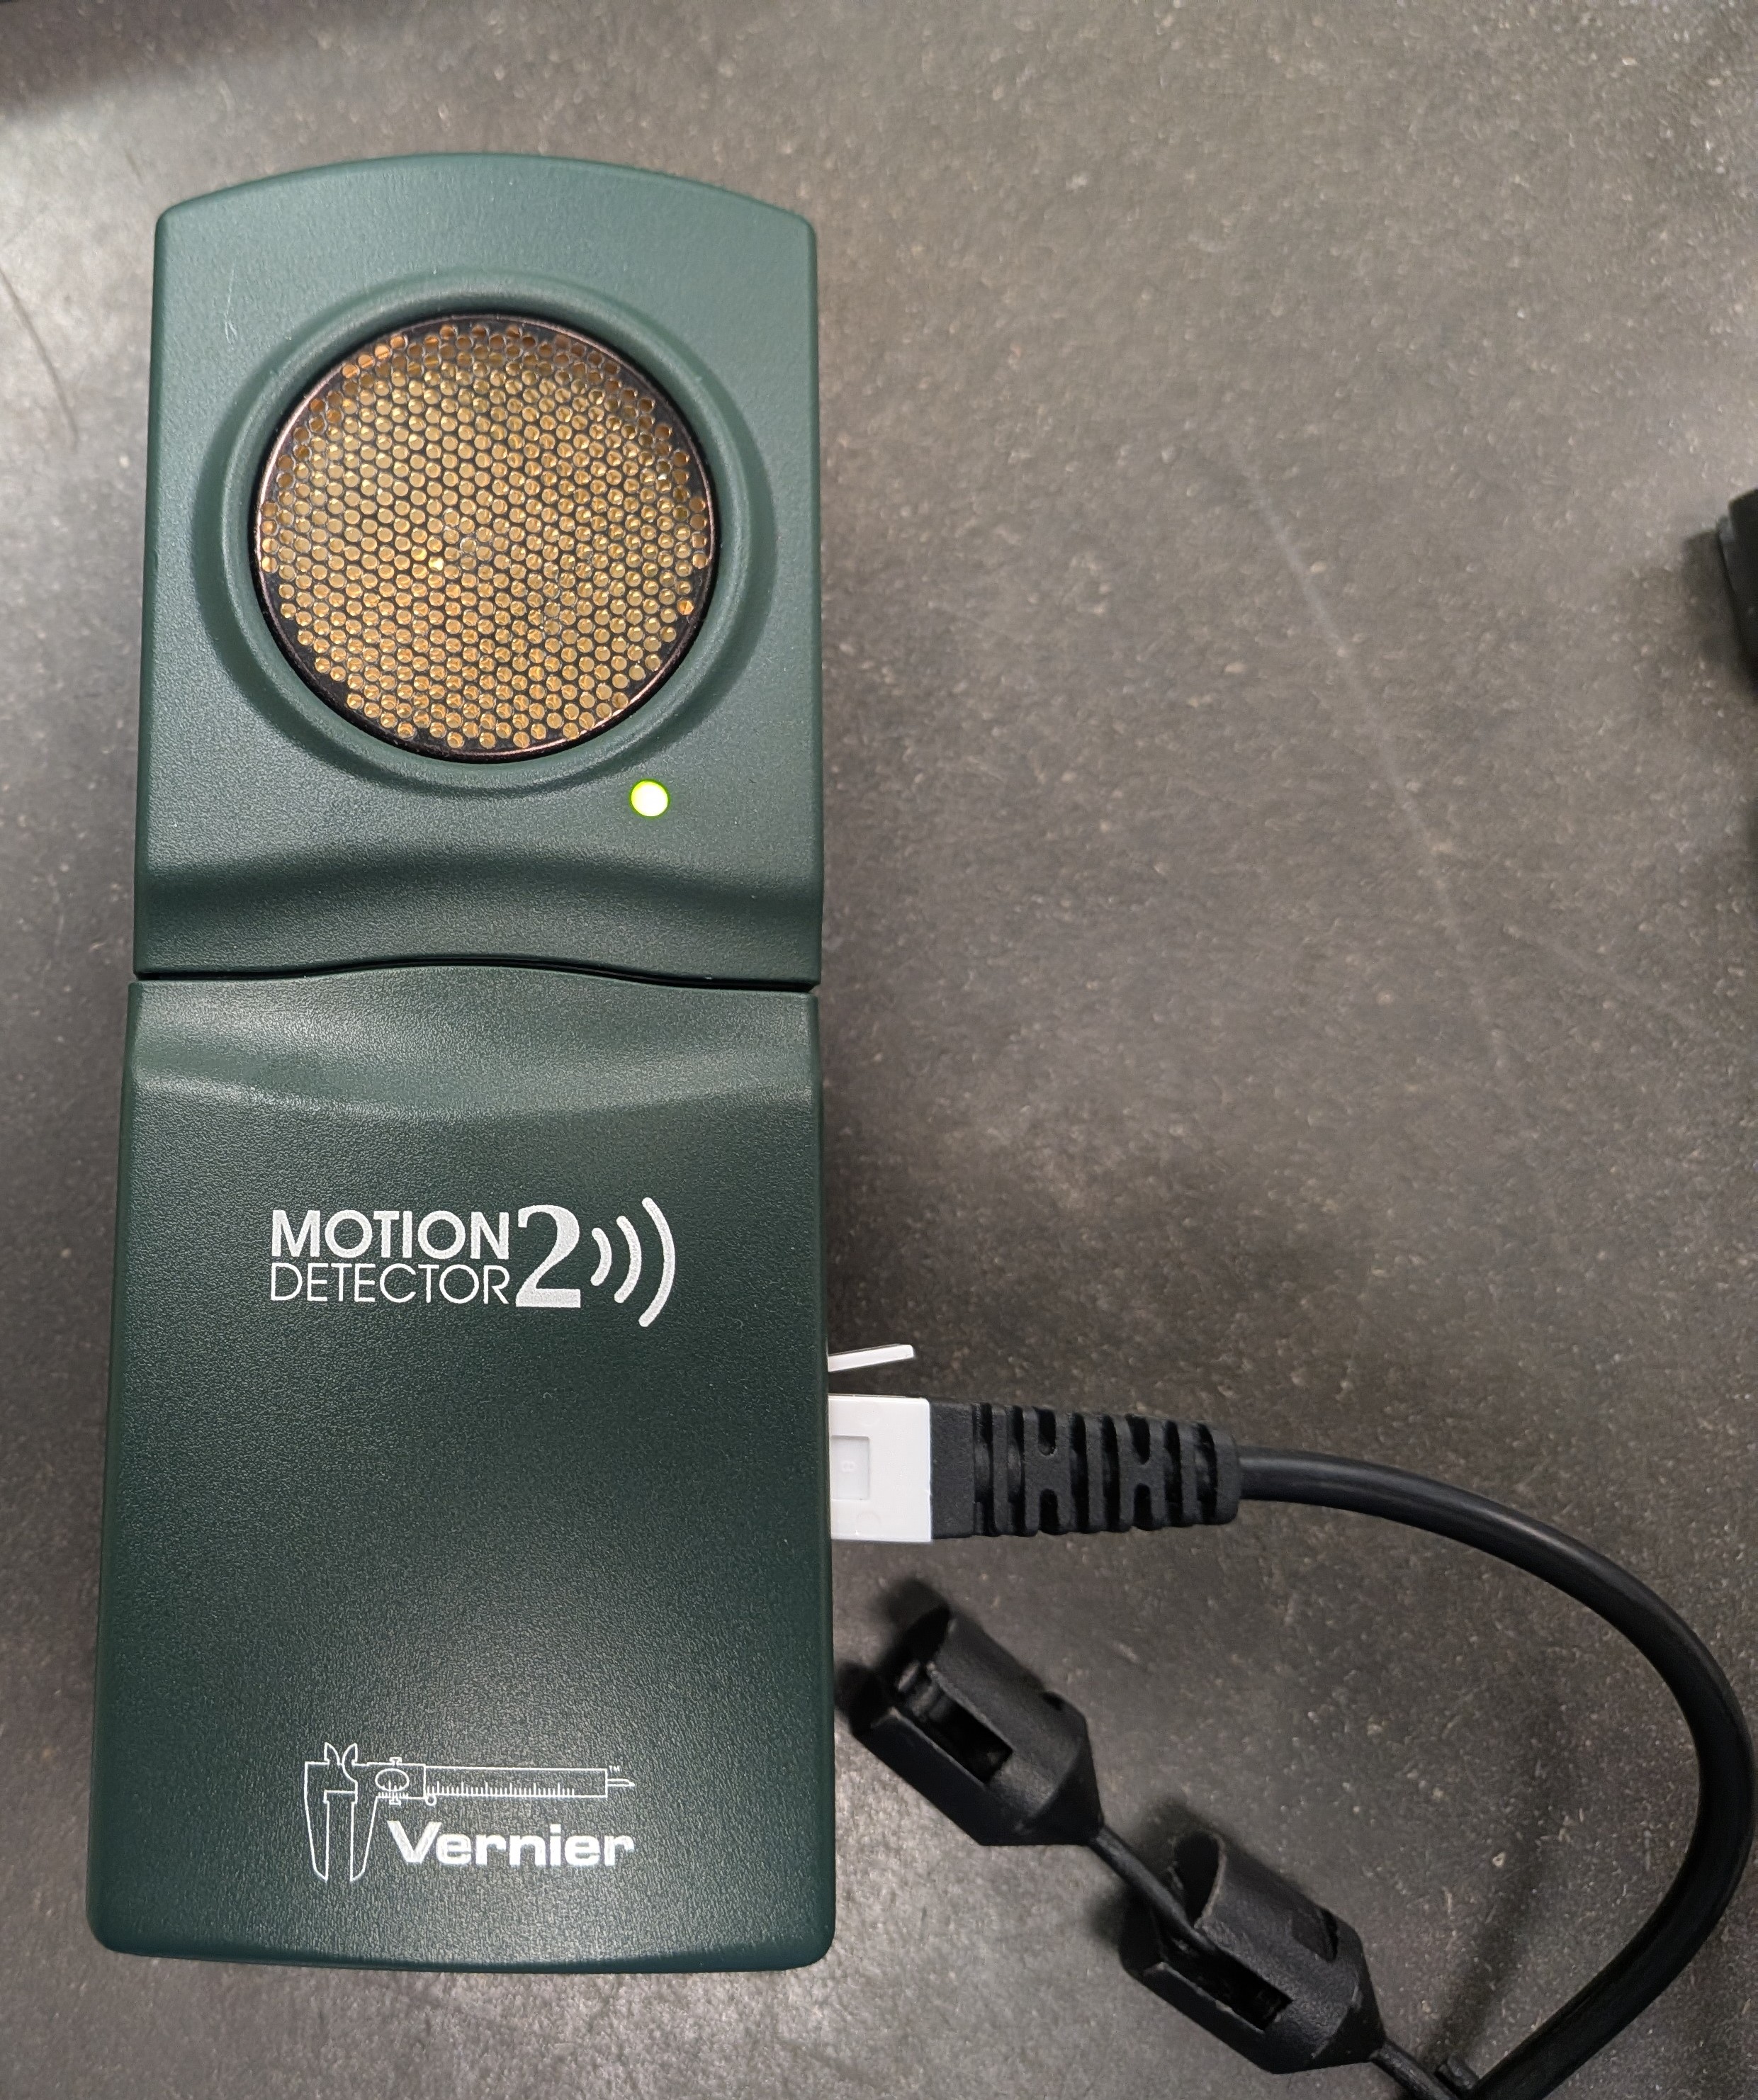
- Vernier Motion Detector 2
- Lab stand with arm plus a spring
- Masses: 4x20 gram and one 50 gram
In a system with springs, we assume that, for modest extensions of compressions of the spring there is a restoring force which acts in the opposite direction to the change in length. Since, in this experiment, we are working in the vertical direction, we will use this expression for Hooke's Law:
$$ F = -k(y-y_0) $$This behavior is very common, ie, we can describe many sytems as having a restoring force which is proportional to the deformation. This response is called Simple Harmonic Motion (SHM). Examples are plucked strings, squeezed or stetched blocks, squeezed volumes of gas and pendulua (ok ... pendulums). Having a force ( \(mass \times d^2y/dt^2\) ) which is proportional to the deformation results in a simple differential equation; one form of the solution is oscillation like a sine wave with amplitude \(A\) and frequency \(f\),1 2 ie:
$$ y(t) = A \sin (2\pi f t) + y_{offset} $$We will examine a spring system in SHM and look at postion \(y\), velocity \( v_y= \delta y / \delta t \) and acceleration \( a_y= \delta v / \delta t \).
Determining spring constant
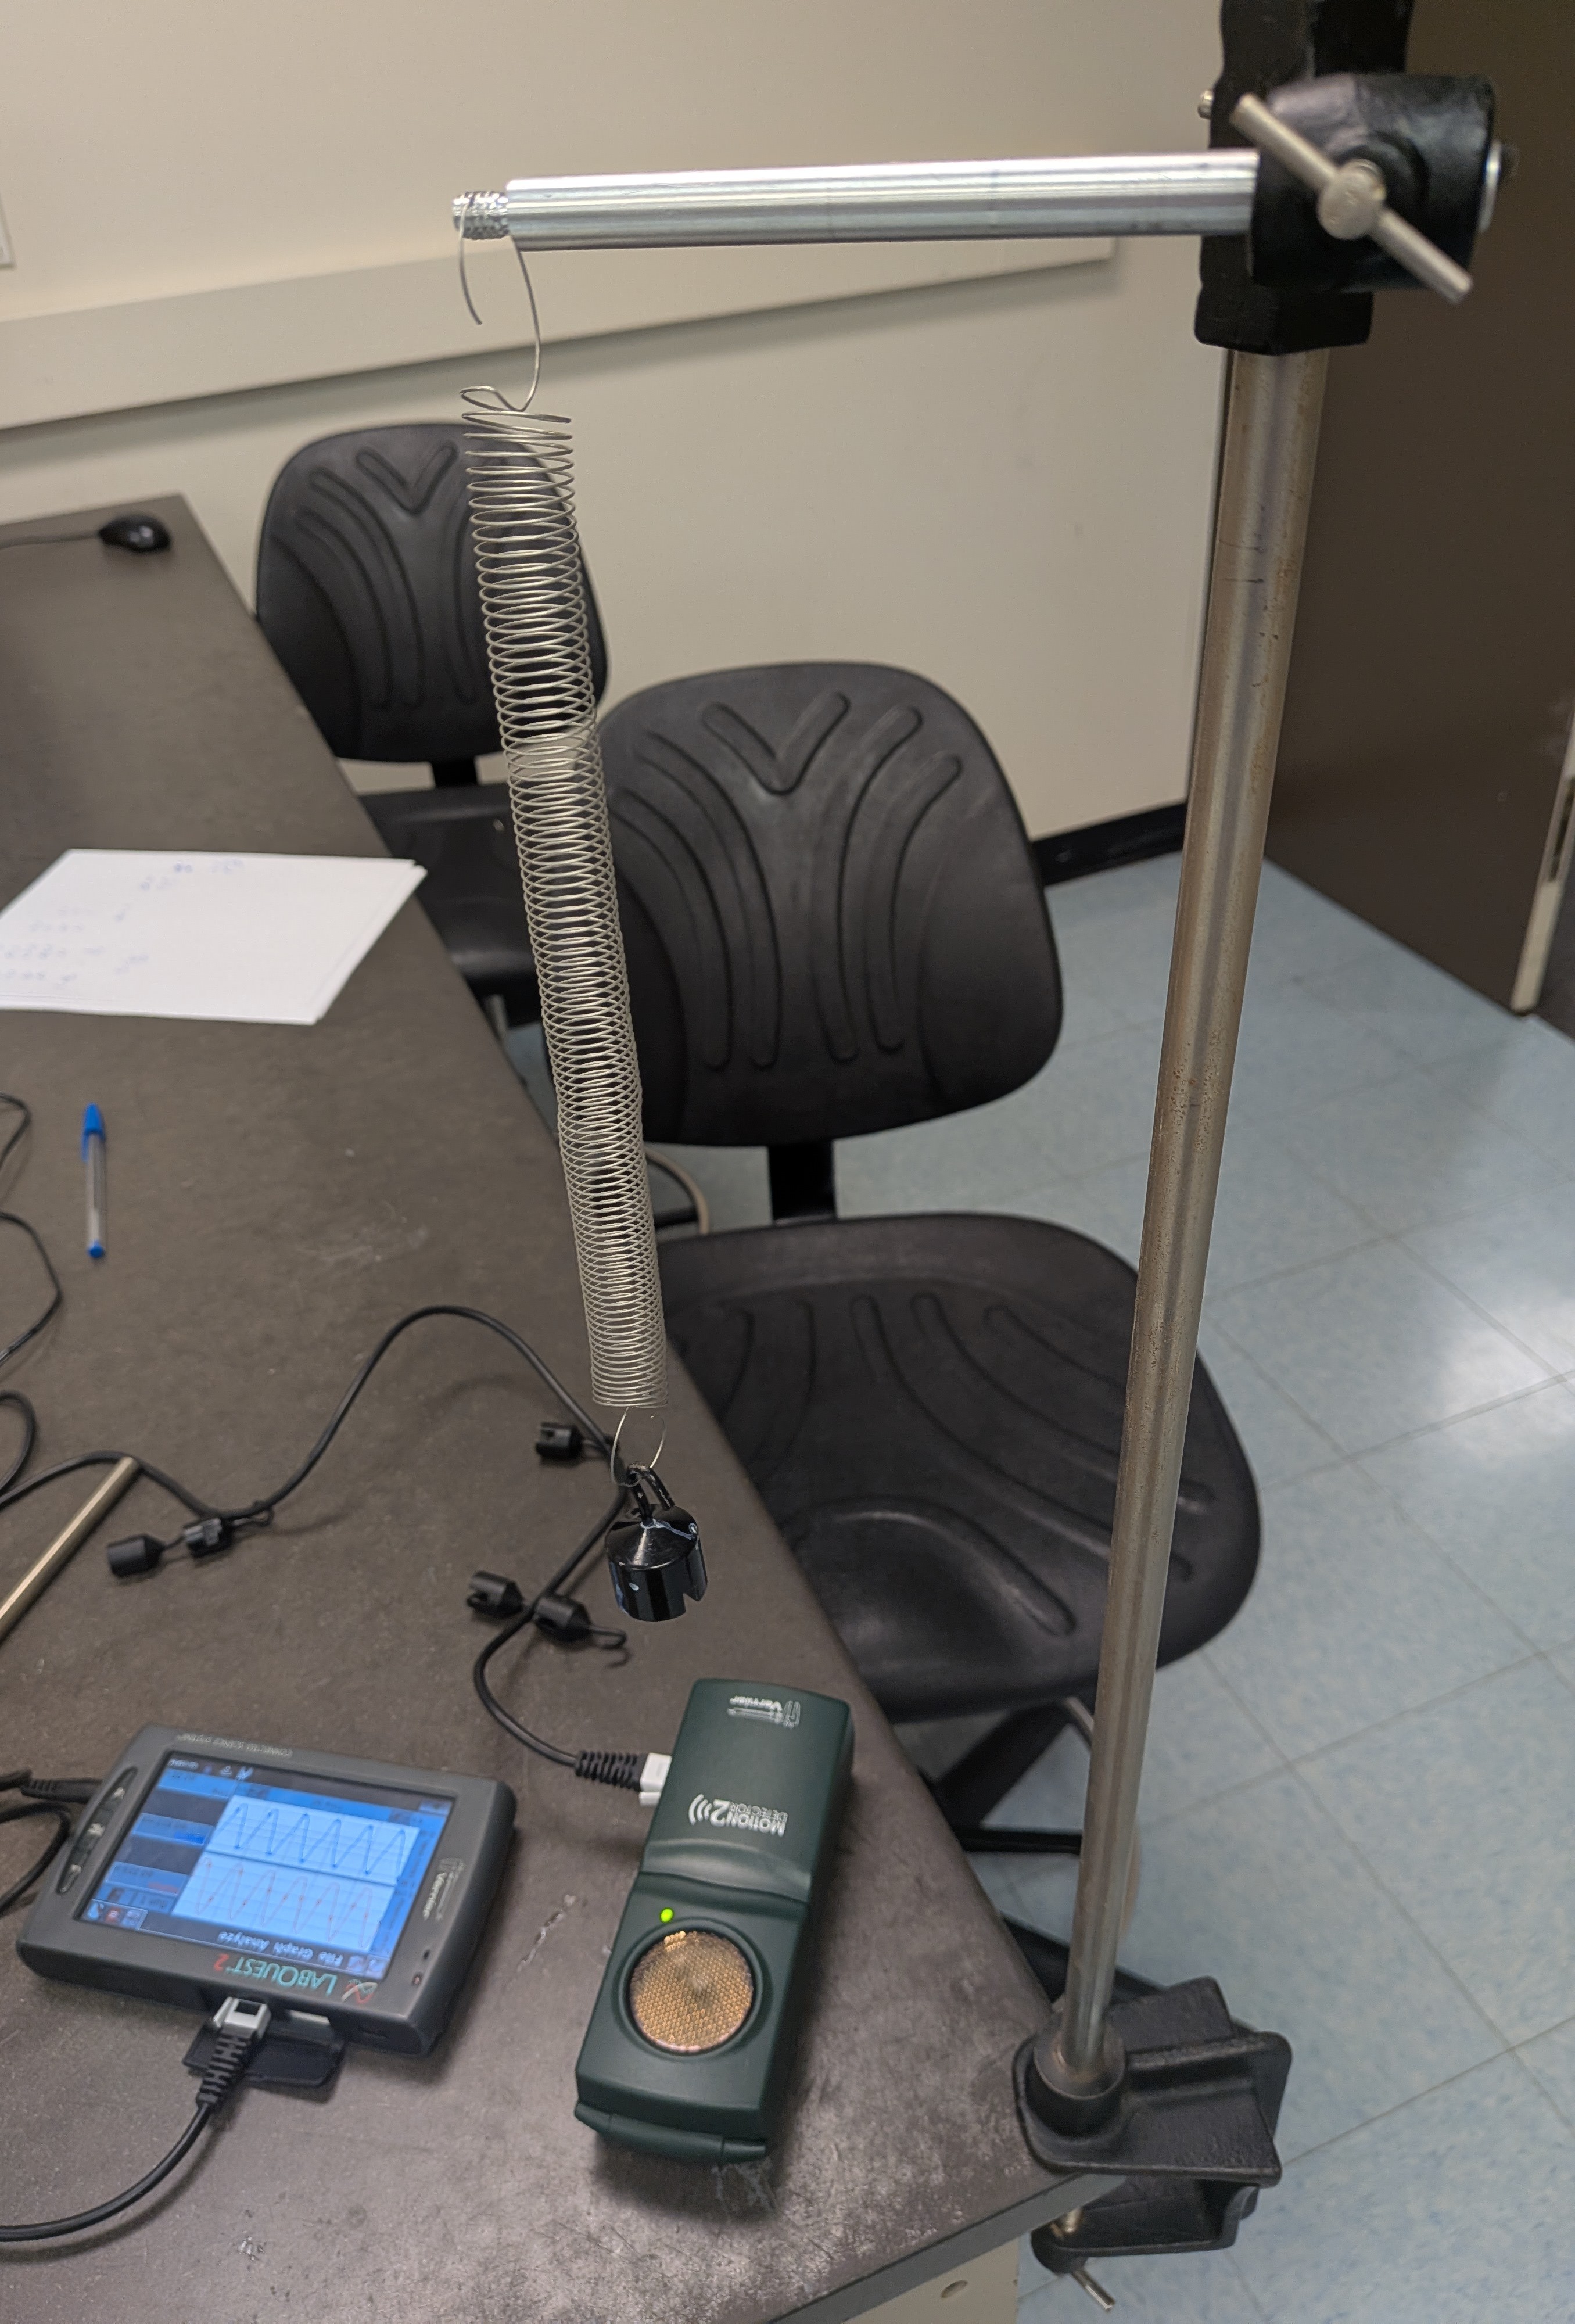
- Hang a spring from the lab stand arm with the arm ~52 cm above the table.
- Measure length of the spring. Include only the "springy" part, not the ends which attach to the arm and will attach to hanging masses.
- Hang a 20 gram mass and measure the new spring length.
- Add 20 gram mass and, for each new total mass, find the new spring length.
Position, Velocity and Acceleration of an SHM system
- Replace the 4x20 gram masses with a single 50 gram mass 1.
- Place the motion detector 2, face up, on the table below the hanging mass. Connect the motion detector to the LabQuest in port Digi 1.
- Pull down on the hanging mass by ~5 centimeters and let go. Start recording data on the LabQuest; it will record for 5 seconds.
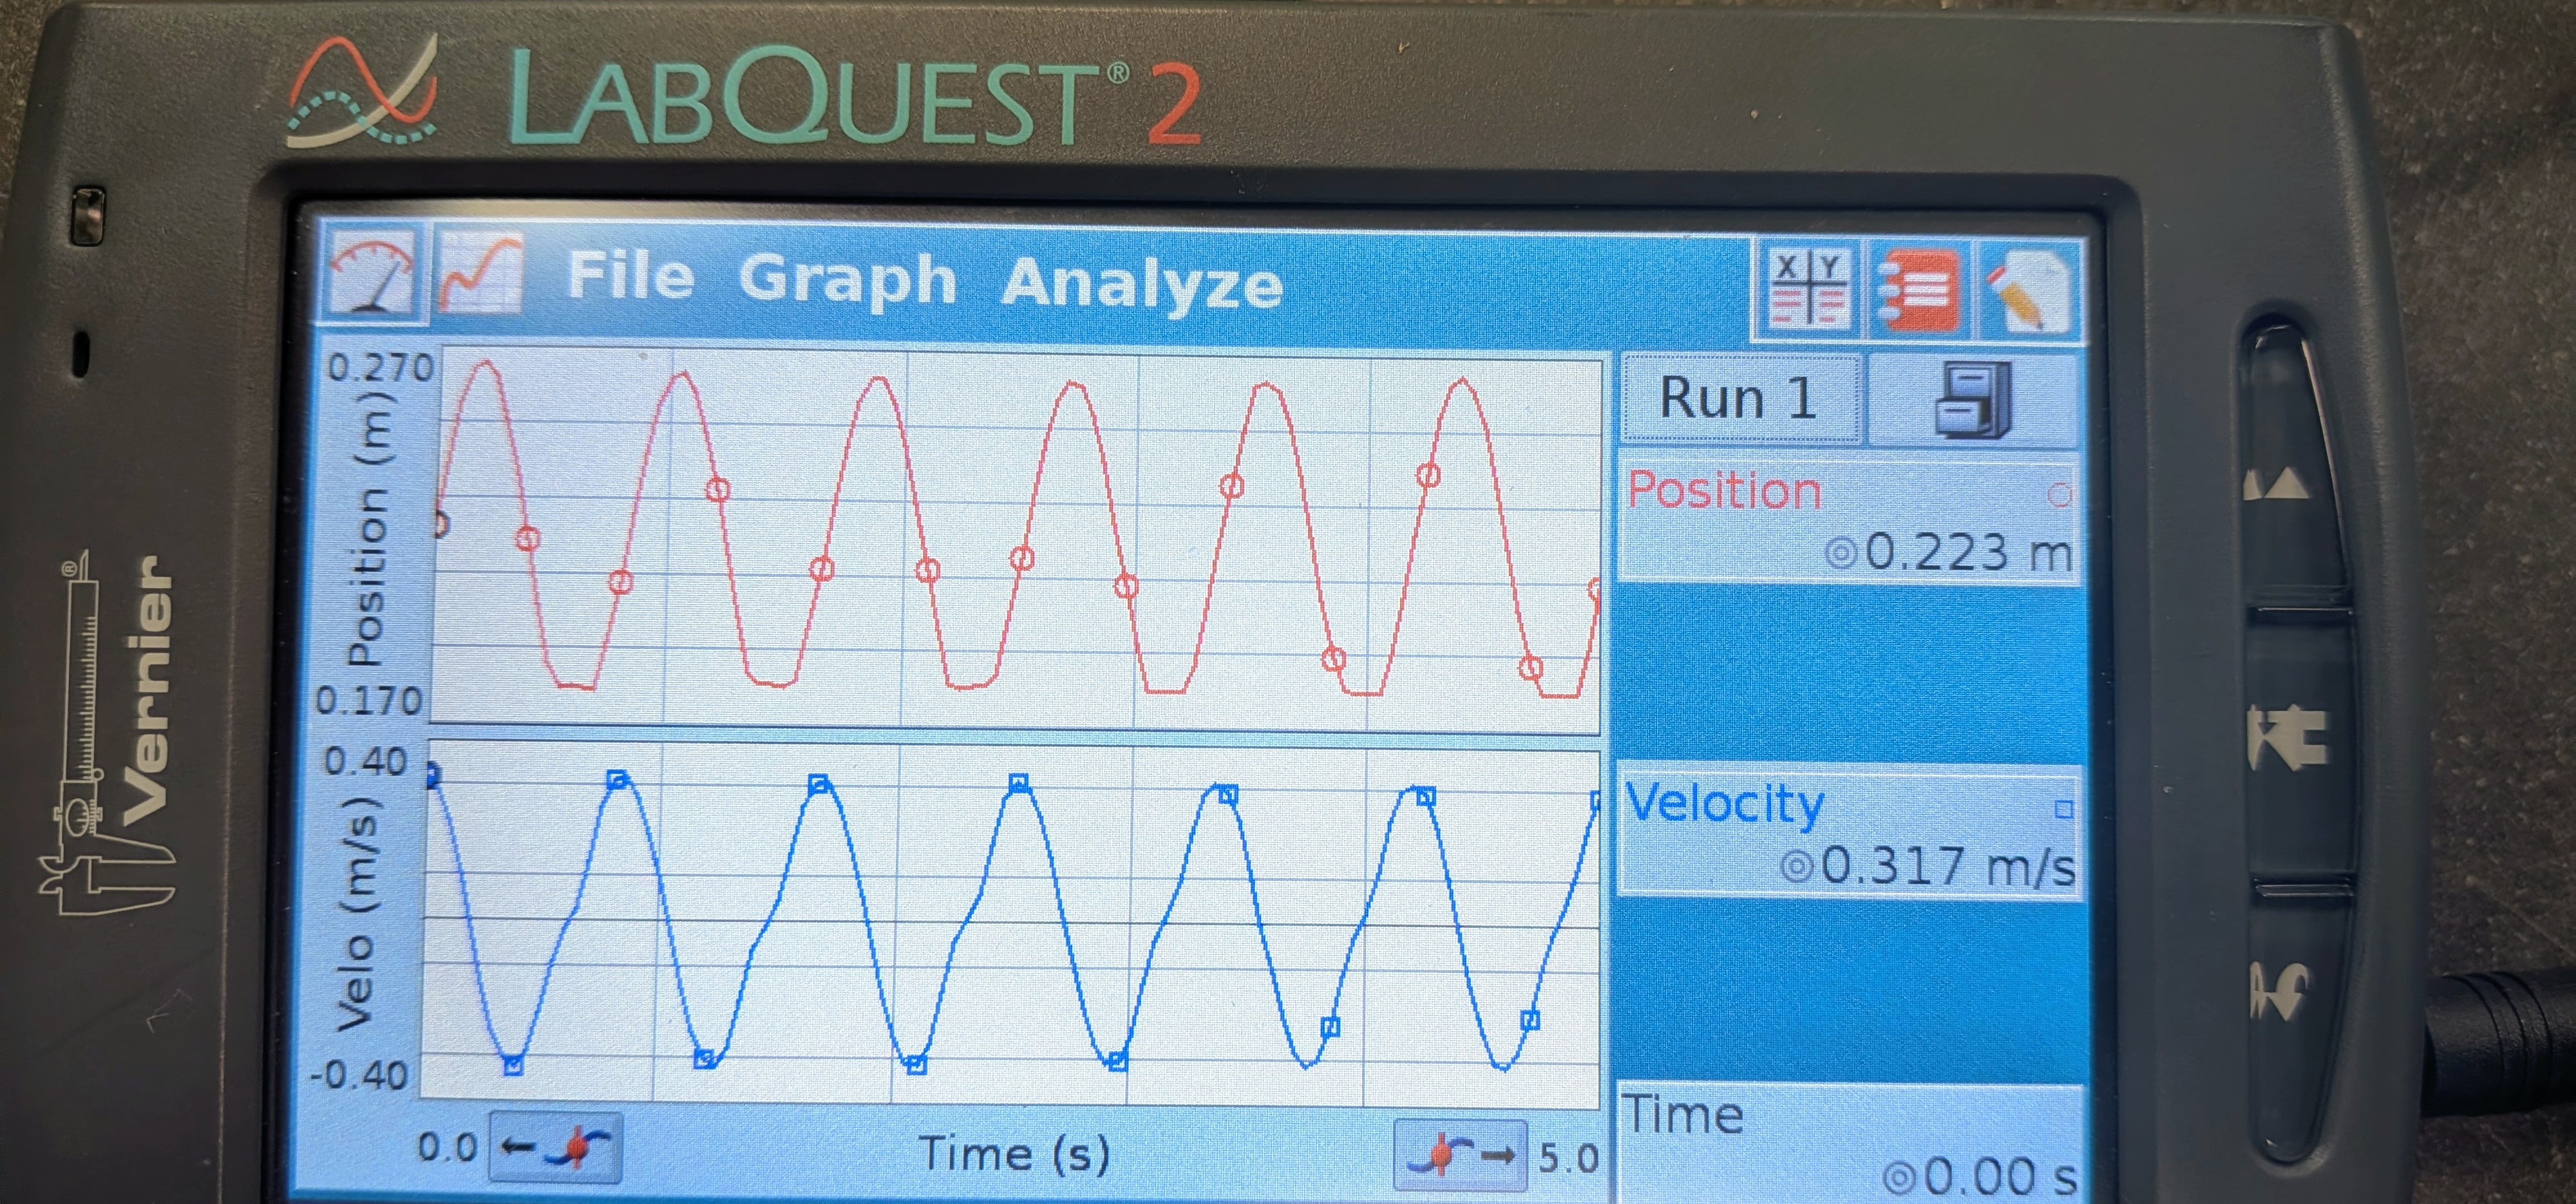
- You should see \( y(t)\) and \( v(t)\) plots (called "Position" and "Velo". They might look like 2 nice, smooth, sinusoidal plots right away, but might show other features. Collect for another 5 seconds, then another, until the plots are simple sinusoids.
Energy in an SHM system
- Do one trial in which you carefully measure the initial displacement (amount you pulled down) of the hanging mass.
- Take the first 5 seconds of data, even if the \( y(t)\) and \( v(t)\) plots have additional wiggles.
Determining spring constant
- Make a plot of the spring length (y-axis) versus the total hanging mass (x-axis).
- Determine the spring constant k from this plot.
- Make an estimate of the uncertainty in k using the maximum and minimum slope from the plot.
Position, Velocity and Acceleration of an SHM system
- Use the \( y(t)\) vs. t plot to find the maximum displacement (Amplitude, A), maximum velocity (slope at the zero-crossing) and period of the oscillating motion.
- Use the \( v(t)\) vs. t plot to find the maximum velocity and compare to your value from the \( y(t)\) plot. Find the maximum acceleration (slope at zero-crossing of this graph).
- Sketch the \( y(t)\) vs. t and \( v(t)\) vs. t graphs plus your best guess at an \( a(t)\) vs. t plot.
- Determine \( f \) for the system and write the equation of motion in the form of Equation 2.
Energy in an SHM system
For the trial in which you measured the initial displacment:
- Calculate the maximum kinetic energy (\(KE_{Max}\)) in the system
- Calculate the maximum spring potential energy (\(PE_{Max, spring}\)) in the system
- Consider the role of gravitational potential energy (\(PE_{grav}\)) in the system
- Compare total mechanical energy for the points when \(KE\) is maximum and when \(PE_{spring}\) is maximum.
Answer the following questions in your lab report:
- Do your plots of \( y(t)\) vs. t and \( v(t)\) vs. t look as you would expect, based on Equation 2? Justify your answer.
- In your last trial, was \(TE = KE + PE\) conserved? Justify your answer.
- Does \(TE = KE_{max} \) or does \(TE = PE_{max} \) ? Justify your answer.
- What behavior led to the extra features in the \( y(t)\) and \( v(t)\) plots other than a simple sinusoidal shape? How does "damping" explain why measurements taken some seconds after the oscillations start are "simpler" and have only one, primary amplitude & frequency.
- We did not calulate uncertainties in this experiment but you used them, implicitly, in answering the previous two questions. Make a (rough) estimate of how well we know \( TE \), \(KE\) or \(PE\). Express as a relative (fractional) uncertainty.
- Would your results have been different on Earth's moon (lower gravity) or if the spring system had been mounted on a low-friction horizontal platform? Justify your answer.
Hovering over these bubbles will make a footnote pop up. Gray footnotes are citations and links to outside references.
Blue footnotes are discussions of general physics material that would break up the flow of explanation to include directly. These can be important subtleties, advanced material, historical asides, hints for questions, etc.
Yellow footnotes are details about experimental procedure or analysis. These can be reminders about how to use equipment, explanations of how to get good results, or clarifications on details of frequent confusion.
Value is from NOAA for Latitude: 40.91597332879679, Longitude: -73.12491620370486, MSL Height: 41.0 Predicted gravity: 980269 +/- 2 milligals where a "gal" is a centimeter per second squared
Often the frequency is expressed as angular frequency \( \omega = 2 \pi f \)
In general, the argument of the trig function also contains a phase shift \(\phi\), measured in radians