
Diffraction
The purpose of this lab is to explore diffraction and interference of light. We will use a diffraction grating that separates the light according to the wavelength belonging to the colors that make up that light. The diffraction grating creates sharp spots of light when illuminated by monochromatic light (light of single wavelength) coming from a laser. Using the diffraction grating, we will determine the wavelength of the red laser light. We will study how a compact disk diffracts light, and we will observe the difference between a regular CD and a DVD. We will study the diffraction by the high resolution display of some mobile devices. Looking through the diffraction grating at various white and colored light sources we will observe the separation of color components that make up the light. Hoveroverthese!
SAFETY NOTE High intensity laser light can damage your eyes. The lasers used in this lab are safe, but nevertheless, do not look directly into a laser. Do not point the laser light in the direction of other students. Do not look directly into the Sun.
NOTE ABOUT COLOR BLINDNESS Color blindness, or color vision deficiency, is the inability or decreased ability to see color, or perceive color differences. Color blindness affects a significant percentage of the population. There is no actual blindness but there is a deficiency of color vision. If you have this condition, some parts of the lab may be difficult for you to execute. Talk to your TA and you will be exempted from doing those parts.
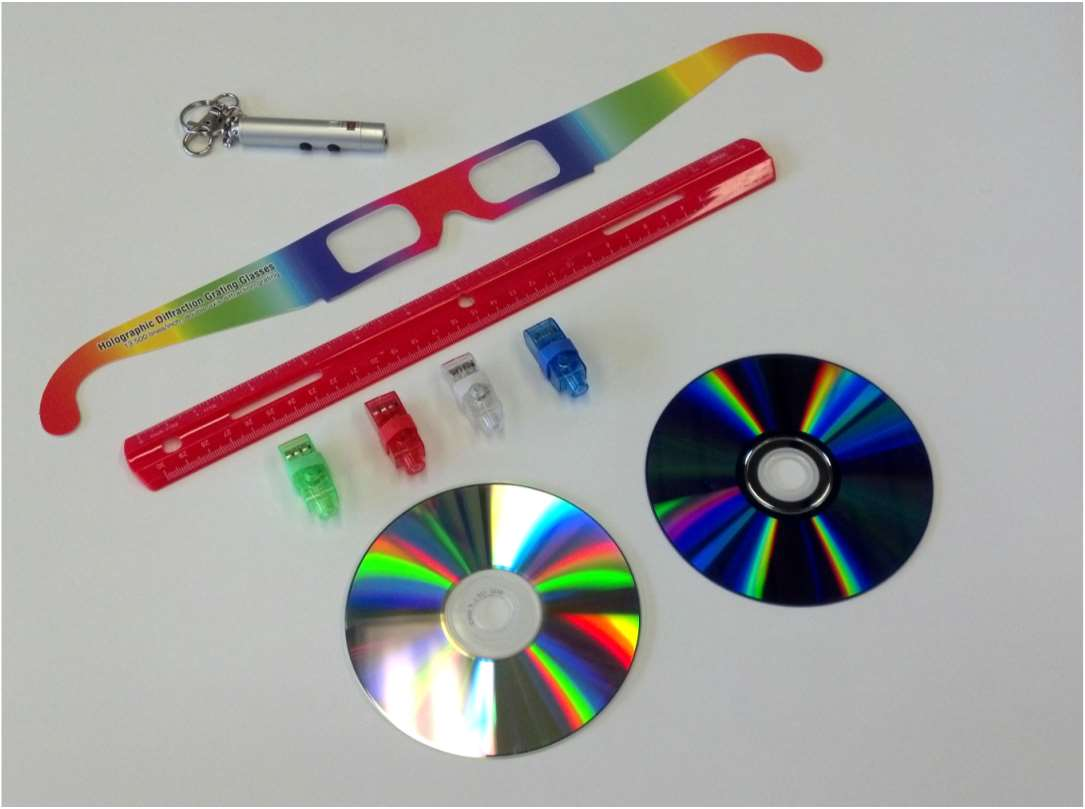
- Holographic Diffraction Grating Glasses
- Miniature color (LED) lights
- CD and DVD
- Red laser pointer
- Large and small rulers
Background
A diffraction grating consists of a large number of equally spaced narrow slits or lines. The grating we use is made by depositing very fine plastic strips on a transparent foil. As light passes through the grating it gets diffracted: instead of just moving in its original direction, a part of the light propagates at a direction that makes non-zero angle \( \theta \) to the original direction. The interference of light waves of wavelength \( \lambda \) coming from different parts of the grating will result in high light intensities at certain values of \( \theta \) and no visible light at other values. For the bright spots $$ \sin{\theta} = \frac{m\lambda}{d} \qquad m= 0, -1, 1, -2, 2, ... $$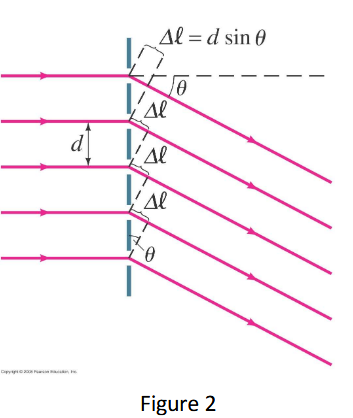
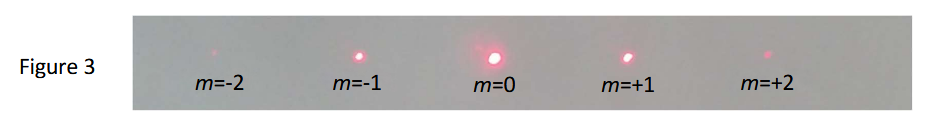
Simple diffraction gratings has one set of lines. When a narrow light beam (laser light) passes through such a grating and projects onto a screen, the diffraction spots will line up in a single line, as shown in Fig. 3. The order of diffraction is also indicated in the Figure.
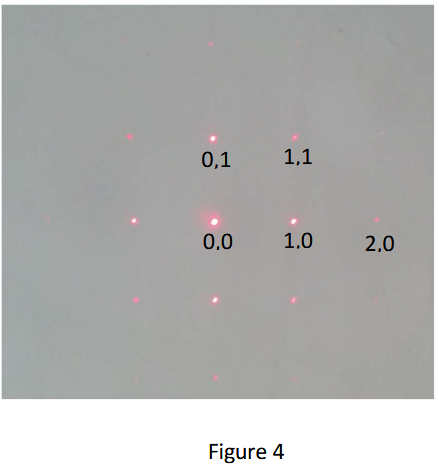
Our “Holographic Diffraction Grating Glasses” has two gratings superimposed in a perpendicular direction. As a result, this grating produces diffraction spots in a square pattern. Indexing the diffraction spots is a bit more complicated: Each spot has two indices, \( m_x\) and \(m_y\). The first index, \( m_x \) , is for the horizontal direction and \( m_y \)is for the vertical direction. A few examples are shown in the Figure. For \( m_y=0 \) Eq. (1) yields the position of the diffraction spots with \( m = m_x \).
Procedure
- Stand in front of the whiteboard at a distance of about 3 feet and point the laser directly to the whiteboard. Hold the diffraction grating vertically in your hand and bring it in front of the laser. Observe the diffraction pattern, and describe your observation.
- What happens if you rotate the diffraction grating in various directions?
- Make a mark on the whiteboard in front of you, so that you can hit that mark with the laser beam approximately perpendicular to the whiteboard. Label this spot with \( m=0 \). Ask your lab partner to help with a large ruler, and measure the distance L of the grating from the whiteboard (use round numbers, like L=50cm or L=100cm). Shine the laser pointer through the grating in a direction perpendicular to the whiteboard so that the direct beam hits the \( m=0 \) point. Hold the grating so that the diffraction spots line up in horizontal/vertical directions, as in Fig. 4. Ask your lab partner to place marks at the diffraction spots that extend in the horizontal direction from the \( m=0 \) spot.
- At the end all of these spots should be on an (approximately) straight line that includes the \( m=0 \) spot. Label the spots with m=+1, m=-1, m=+2, m=-2 e.t.c., where m is the order of diffraction. You should get something similar to Fig. 3.
- Measure and record the distance x between the \( m=0 \) spot and the others.
Evaluate the Data
Evaluate the data:
- The grating has 5,000 lines per inch (some of the gratings have “13,500 lines per inch” printed on them, but that is incorrect). What is the value of \( d \) in Eq. 1?
- Complete a table (such as Table 1 below) with the measured data. Use \( tan(\theta) = x/L \) to determine the angle of
diffraction. Use Eq 1. to calculate \( \lambda \).
m x in cm \( \theta \) \( \lambda \) +1 -1 +2 -2 +3 -3 - We will assume that the wavelength has a random error (or uncorrelated uncertainty. So, to determine the measured value of \( \lambda \), we take the average of the values in the table. The associated uncertainty is given by the first equation in the Quick Reference for Uncertainties. Note that this is also conventionally known as the standard deviation of the set of \( \lambda \) values.
Questions
Answer the following questions in your lab notebook:
- What is your value of \(\lambda\)?
- Compare your value to reasonable values for a red LED light. Does it agree within experimental uncertainty?
Background
The information on a CD or a DVD is recorded on a very fine spiral pattern. Looking under a microscope at a smaller part of the disc we would see something very similar to a diffraction grating: very fine, regularly spaced lines. Therefore a CD or a DVD creates diffraction spots similar to the diffraction grating. A minor difference is that the lines on the CD are a bit curved. The only major difference is that the disk acts as a mirror, and we cannot look at the transmitted light, but we study the reflected light. In this configuration the 0th order diffraction is the directly reflected light. The angles of higher order diffracted beams relative to the 0th order diffraction can be still calculated from Eq. (1).
The goal of this part is to compare the distance between the lines on the CD to distance between the lines on the DVD. On a CD the distance between the lines is \( 1.6 \times 10^{-6} \)m = \( 1.6 \mu m \). One expects that the distance on the DVD is shorter, and the lines to have higher density, since the DVD can store more information.
Procedure
- Place the CD “shiny” face up on the ledge of the whiteboard.
- Hold the laser about 1m height, right above the CD. Support your hand on the whiteboard so that you can point the laser accurately and steadily.
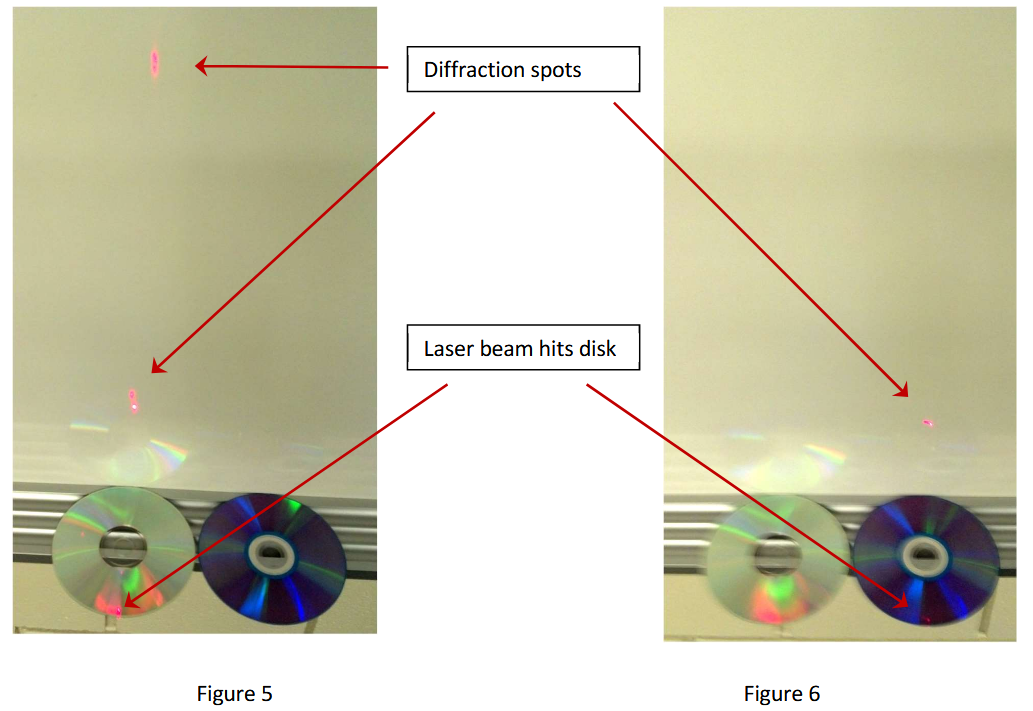
- Point the laser vertically downwards, so that the beam hits the CD close to the outer edge (see Fig. 5).
- You should see two diffraction spots. They move as you slightly change the spot where the laser beam hits the CD. Tune the direction of the laser so that the two diffraction spots are approximately in a vertical direction above from the CD.
- Ask your lab partner to mark the position of the CD, and the positions of the spots on the whiteboard.
- Ask your lab partner to replace the CD with the DVD at the exact same position.
- Tune the direction of the laser so that it hits the DVD similar to what you did with the CD.
- You should see a single diffraction spot (see Fig. 6).
Evaluation and Questions
- Try to determine, using Eq. (1), what is the angle of the third order diffraction (\(m=3\)) for the CD with the red laser. Use \(d= 1.6\) mm and \( \lambda=650\)nm. (After this step no more calculations are necessary in this part of the lab.)
- Label the diffraction spots of the CD with \( m=1 \) and \( m=2 \). Keep in mind that the lower the order the smaller is the angle relative to the directly reflected beam. Where would be the m=3 spot?
- There is only one diffraction spot for the DVD. What is the order? (m=?)
- Based on the position of the \(m=2\) spot of the CD and the \(m=1\) spot of the DVD, what can you conclude about the line spacing \( d \) of the DVD?
Background
Please note: For the rest of the lab we will not use the laser. Please give the laser back to the TAs.
With all the nanotechnology around us, CDs and DVDs are not the only products with very fine and regular structures that act as diffraction gratings. One area of fierce competition in the electronics industry is the high-definition displays of mobile devices, where higher “pixel density” (or pixel per inch, ppi) is an important selling point. Generally, the human eye cannot see individual pixels when the density is higher than 300ppi. Many Apple products have higher ppi: 401 ppi for the iPhone 6 Plus, 326 PPI for the iPhone 4, iPhone 4S, iPhone 5, iPhone 5C, iPhone 5S, iPhone 6. A high-end Samsung Galaxy has 515 ppi and the latest LG has 538 ppi.
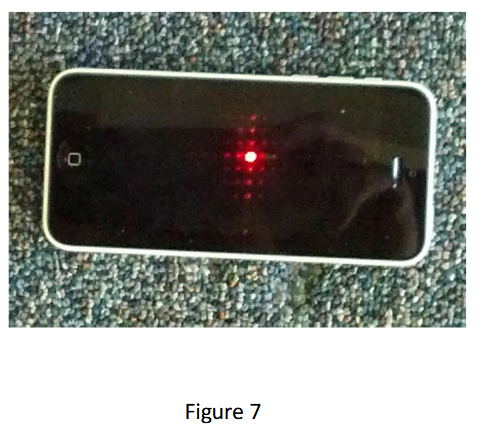
Figure 7 shows the diffraction of the red light from an iPhone 5. In this lab you will determine the ppi of your phone, or a phone that you borrow from your lab partner. Note: not all displays produce visible diffraction patterns, for two reasons. First, it is possible that the display has a low resolution (lower ppi) and the diffraction spots are too close and blurred together. Second, some of the displays has a layer of liquid crystal that may obscure the underlying fine structure that causes the diffraction.
Procedure
- Place the mobile phone on the ledge of the whiteboard, so that it is approximately vertical. (Alternatively, place it flat on the floor as in Fig. 7, but be careful, do not step on it.)
- Switch on the small red light. Do not use the laser.
- Hold the light close to your eyes (e.g. in front of your mouth, or next to your ear), pointing towards the display. Move around your head and the light source until you see the reflection of the red light and the diffraction pattern, similar to that is shown in Fig. 7.
- Switch to another phone if there is no visible diffraction.
- Design a method to measure a, the distance between the diffraction spots. (For example, in Figure 7 we can see that about 13 spots fit into the full width of the phone. Therefore the distance between the spots is equal to the width of the phone divided by 13. Or you can take a photograph with another mobile phone and measure the distances on the image.)
- Measure the distance \(L\) between you and the phone.
Evaluation and Questions
- Calculate \(\sin{\theta}\) from \(a\) and \(L\). Since \( a \ll L \) you can use \( \sin{\theta} \approx \tan{q} = a/L \)
- Use Eq. (1) with \(m=1\) to determine \(d\)
- Calculate \( 1/d\) and convert it to pixel per inch.
- Using \( \lambda_{red} = 650 \)nm for the red LED, does your value for ppi agree with an expected value for your phone?
Background
White light is made of the mixture of various colors, each color corresponding to electromagnetic radiation of a given wavelength. Due to the makeup of the human eye, we may see the same white light for many different mixtures of the colors. For example, the sunlight has all the colors of the rainbow, but we can make white light just by mixing the “pure” red, green and blue colors. (For reference, the wavelengths of the three principal colors are \( \lambda =650\)nm for red, \( \lambda=510\)nm for green and \( \lambda=475\)nm for blue.) Similarly, some of the colors can be mixed from two or more different colors. For example, green can be either the pure (monochromatic) green from the rainbow or it can be mixed from yellow and blue.
A spectrometer is a device that can separate (according to their wavelength) and analyze the various color components of the light. (In a broader sense, spectrometers are used to determine the components of any type of electromagnetic radiation. Spectrometers are used widely in scientific research and industry.)
In this part of the lab you will turn your eye (or your mobile phone camera) into a spectrometer. All it takes is placing a diffraction grating in front of the eye (or in front of the lens of the camera), looking at the light source, and watching for the first or second order diffraction spots. This works best if the light source is small and bright. The miniature light sources used in this measurement do not last very long. When you do not use them, always switch them off. Do not use the laser.
Procedure
- Bend the Holographic Diffraction Grating Glasses into shape and put it on as reading glasses.
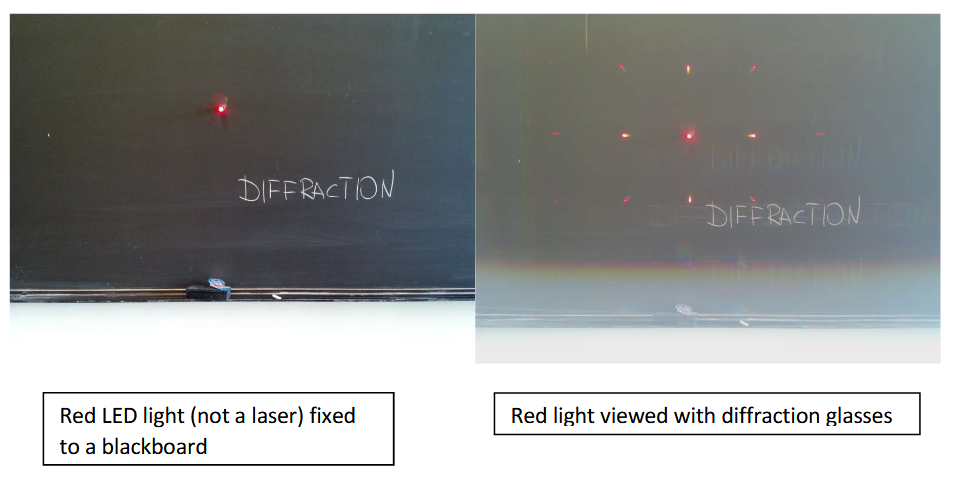
- Switch on the small red light and place it on the edge of the table so that the light beam is approximately horizontal. Do not use the laser.
- Look directly into the light from a distance of a few yards. Describe your observation.
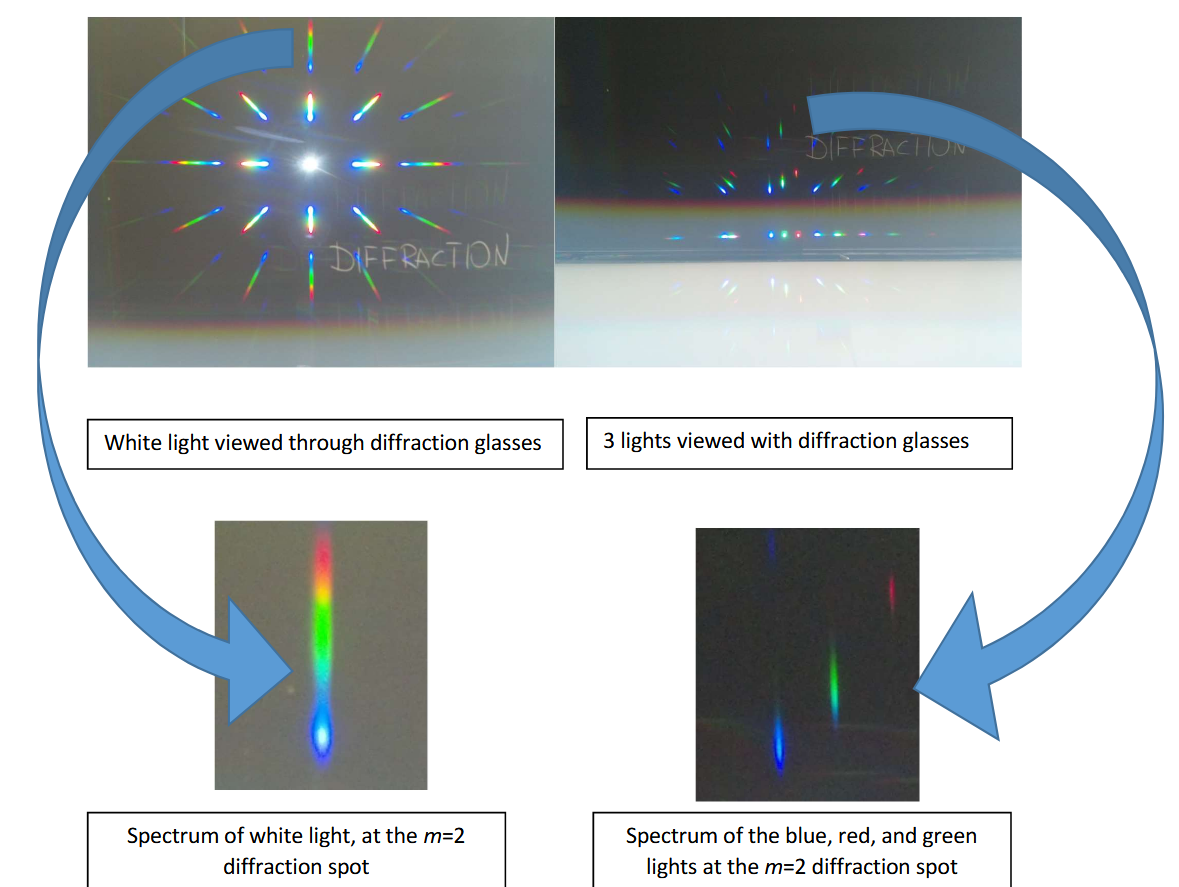
- Switch off the red light, and replace it with the white light. Describe your observation.
- Switch off the white light. Switch on the three colors and place them next to each other all pointing in the same direction.
- Look directly into the lights. Describe your observation. The photos on the next page illustrate the various tests recommended above. The camera used for taking these photos has a limited “dynamic range” and it cannot reproduce the color properly when the intensity of the light is high. Instead of the real color the camera produces a saturated white. As you will see, the human eye is much better in this respect.
Questions
Answer these questions:
- Is the red light “pure” or does it have other colors in it?
- Is the blue light “pure” or does it have other colors in it?
- Is the green light “pure” or does it have other colors in it?
Further Questions
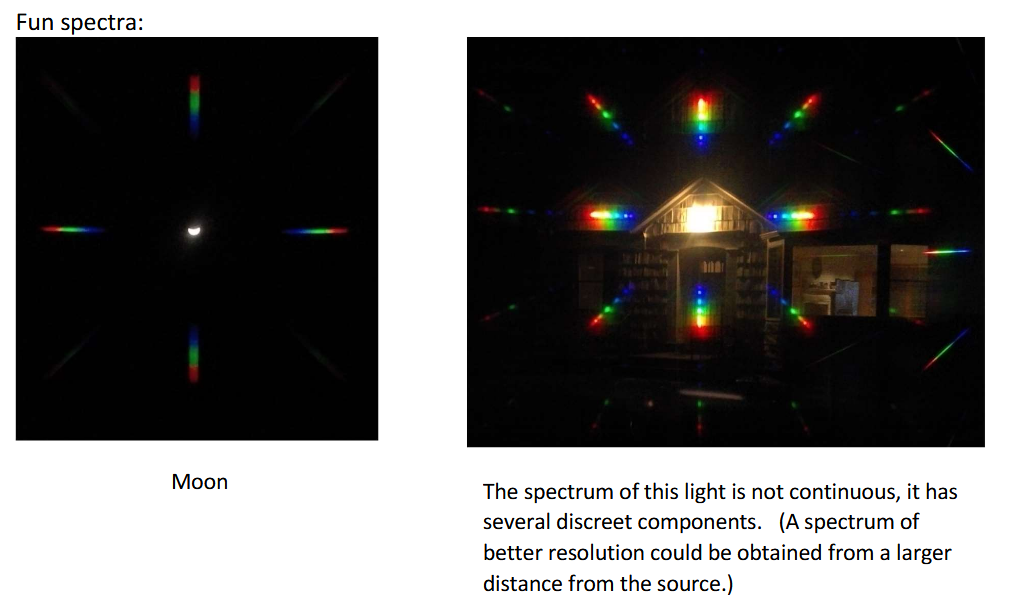
Answer at least one of these questions. It is best to explore and experiment in the evening, when contamination from other lights is minimal. When you look at the light you want to analyze make sure that light is far enough so that the light source seems to be small, almost point-like. For a clear observation, it is important that there are no other bright lights around. Observe the spectrum in the m=2 diffraction spot, see page 7. Describer the spectral composition in terms of the colors you see in the spectrum. For example, you may say that the “spectrum is continuous from red to violet” when you describe the light from an incandescent light bulb. The white light from a LED source has a spectrum that is “continuous from red to violet, but there is a slightly reduced intensity at the blue” (see page 7, bottom left). The red light from a LED source has a spectrum that is “only red with a little bit of yellow” (see page 7, bottom right). A light from a compact fluorescent light has “only a few colors, and very little in between” (you should name the colors). Do not drive while wearing the Holographic Diffraction Grating Glasses.
- What are the spectral compositions in the red, green and yellow traffic lights? (There are two types of traffic lights: LED lights and traditional lights. The LED lights are made of many tiny LED sources and one can see a visible composite structure.)
- What are the spectral compositions of a neon sign? (For example, the red “OPEN” sign often displayed in stores.)
- What is the spectral composition of the blinking yellow turn signals of the cars?
- What is the spectral composition of a compact fluorescent light?
- What is the spectral composition of the lights in SBU’s LaValle Stadium?
- What is the spectral composition of the lights on the Academic Mall?
1/23/2017 .docx file available from Laszlo Mihaly
Hovering over these bubbles will make a footnote pop up. Gray footnotes are citations and links to outside references.
Blue footnotes are discussions of general physics material that would break up the flow of explanation to include directly. These can be important subtleties, advanced material, historical asides, hints for questions, etc.
Yellow footnotes are details about experimental procedure or analysis. These can be reminders about how to use equipment, explanations of how to get good results, troubleshooting tips, or clarifications on details of frequent confusion.