Acceleration


The purpose of this lab is to measure the gravitational acceleration constant \(g\) by measuring the rate at which a falling object increases its speed. Hoveroverthese!
Equipment
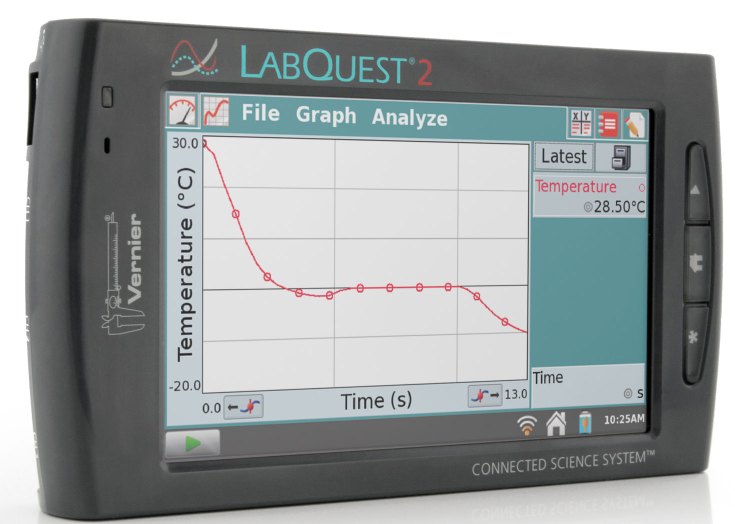
- LabQuest 2
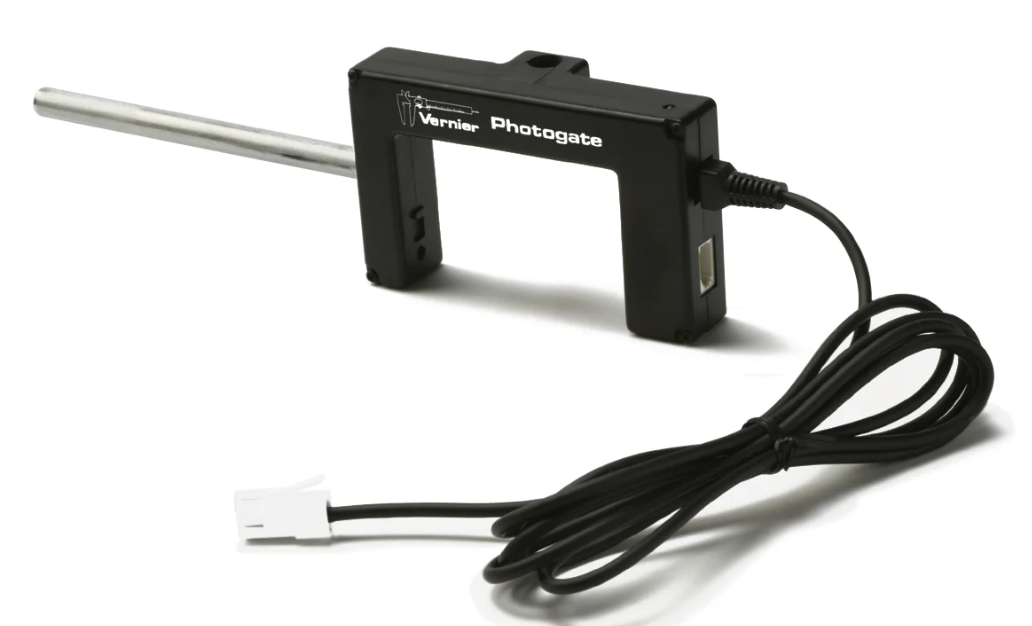
- Vernier Photogate
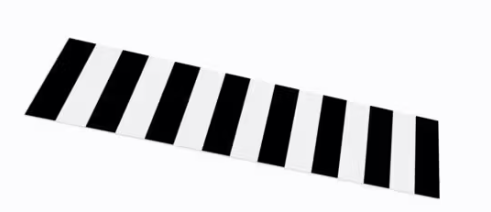
- Picket fence
- Stand and clamp
- A useful Google Sheets data table
Free Fall is motion in one dimension, where the only force acting on an object in free fall is the gravitational force. That means any drag force, such as air resistance, must be zero or so small as to be neglected. As a result, the object experiences a downward acceleration, \(g\). If the object falls near the Earth’s surface, the value of this acceleration is constant and the accepted value is \(g= 9.81 m/s^2\). 1
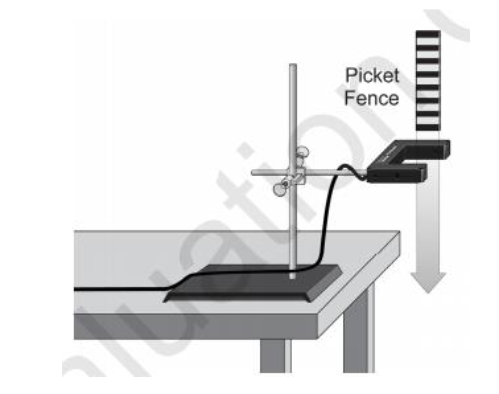
In this lab, you will drop a picket fence through a photogate to measure the acceleration due to the Earth’s gravity experimentally. The picket fence has eight opaque bars spaced every 5 cm that will block the infrared light beam of the photogate. The interface measures the time from the leading edge of one bar blocking the beam until the leading bar of the next bar blocks the beam. This timing continues as all eight bars pass through the photogate. The software calculates the velocity and acceleration of each interval using the measured times. With this information, the software will plot distance vs. time, velocity vs. time and acceleration vs. time graphs. Pay careful attention to these graphs of motion.
Determine experimentally the gravitational acceleration constant
- Connect the photogate to the digital channel port of the LabQuest2 and check that it has the
right setup for this experiment. On the right of the Meter screen (Tab A) you will find a Data-Collection details row. Verify that the
“Mode” says “Photogate Timing”, click in the Mode option, and in “Photogate Mode” select “Motion” and choose the “Vernier Picket Fence” option. By default, the “End Data Collection” option is selected. Keep this option.

- Test the photogate and LabQuest2. Block the light beam with your finger and check if the LabQuest2 shows as “Blocked” and the red led of the photogate is on. Remove your hand, the red led should turn off and the display should change to “Unblocked.”
-
Press collect data (Start) on the LabQuest. Hold the picket fence just right above the center of the photogate without blocking the beam. Release the picket fence to have an initial velocity of approximately zero. Make sure that it is oriented perpendicular to the light beam and does not touch the photogate during its fall.
 Note: Make sure that the entire length of the picket fence passes through the photogate and blocks the beam, check distance vs. time graph, you should have at least seven values (from 0.05 to 0.35 m), otherwise, you must discard that drop. Having fewer points means that the picket fence is not falling in a straight line and it has an inclination with respect to the photogate which can give wrong
values of measured time. Think about why the measured times are not reliable in this situation.
- Repeat for five more measurments (six in all).
Determine experimentally the gravitational acceleration constant
- For each measurement, find the data under Tab C on the Lab Quest. Make two graphs: distance versus time and velocity versus time. Draw a smooth line of best fit to approximate the shapes of the curves. Do the graphs of distance versus time, velocity versus time have the behavior that you expect? Think about of the meaning of the slope in each graph.
- Take the graph velocity versus time and fit a straight line to your data. To do this, select the data on your graph and go to “Analyze” and then “Curve Fit”. Select “Linear“ in the fit equation option, and then click OK. Record the values of the slope \(m\) and y-intercept \(b\). What do these values represent in this graph?
- Repeat previous steps for each set of data.
- From the six values of slopes, find its average and its absolute error, \(m ± \Delta m \) using equations 2 and 3 from the Guide to Error Analysis (or the first equation in the Quick Reference).
- Calculate the percentage error and check whether your measured value is consistent with the accepted value of \(g= 9.81 m/s^2\).
Answer the following questions:
- Hold the picket fence a few inches above the photogate and then drop it through the photogate. Then look at the velocity vs. time graph from the LabQuest2 and record the initial velocity from the graph. Is your initial velocity greater or less than the one you recorded earlier?
- Does the experimental value of the acceleration \(g\) you found depend on the mass of the object? How could you test this?
- If you were to do the experiment one more time, but instead of releasing the picket fence, you give
it an initial velocity directed downward:
- Is the acceleration due to gravity less than, equal to, or greater than the one you recorded earlier?
- What would the velocity vs. time graph look like? In terms of the slope \(m\) and the y- intercept at t=0, \(b\) . Make a sketch of both cases (releasing and giving an initial downward velocity to the picket fence) in the same graph.
- If you were to do the experiment one more time, but instead of releasing the picket fence, you give
it an initial velocity directed upward:
- Is the acceleration due to gravity less than, equal to, or greater than the one you recorded earlier?
- What would the velocity vs. time graph look like? In terms of the slope, \(m\), and the y- intercept at t=0, \(b\). Make a sketch of both cases (releasing and giving an initial upward velocity to the picket fence) in the same graph.
Hovering over these bubbles will make a footnote pop up. Gray footnotes are citations and links to outside references.
Blue footnotes are discussions of general physics material that would break up the flow of explanation to include directly. These can be important subtleties, advanced material, historical asides, hints for questions, etc.
Yellow footnotes are details about experimental procedure or analysis. These can be reminders about how to use equipment, explanations of how to get good results, or clarifications on details of frequent confusion.
Value is from NOAA for Latitude: 40.91597332879679, Longitude: -73.12491620370486, MSL Height: 41.0 Predicted gravity: 980269 +/- 2 milligals where a "gal" is a centimeter per second squared