The emission spectrum of Hydrogen
Introduction
In this experiment you will measure the visible part of the hydrogen spectrum, the Balmer series, and determine the Rydberg constant Ry.
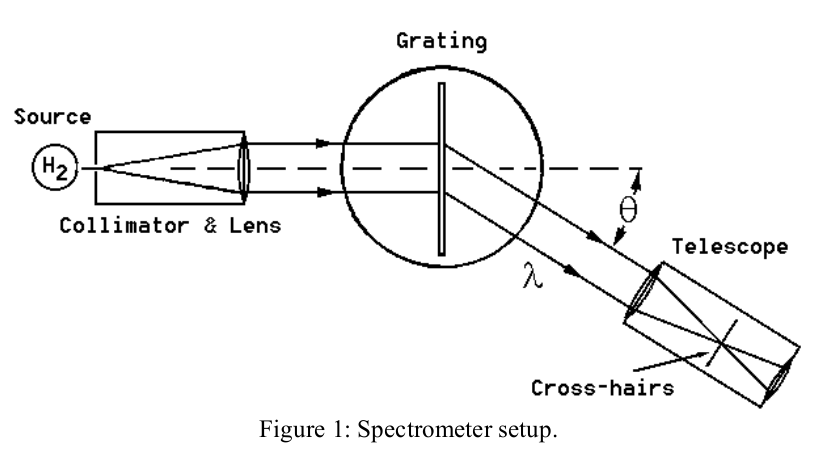
If parallel rays of light are incident perpendicularly to the plane of a diffraction grating, with uniform phase over the grating, then one will observe a diffraction pattern which will have a series of intensity maxima at angles θ satisfying the equation
where λ is the wavelength of the emitted light, and d is spacing between adjacent grooves on the grating. Thus the grating will allow a determination of an unknown wavelength if the positions of the intensity maxima are measured and d is known.
Apparatus

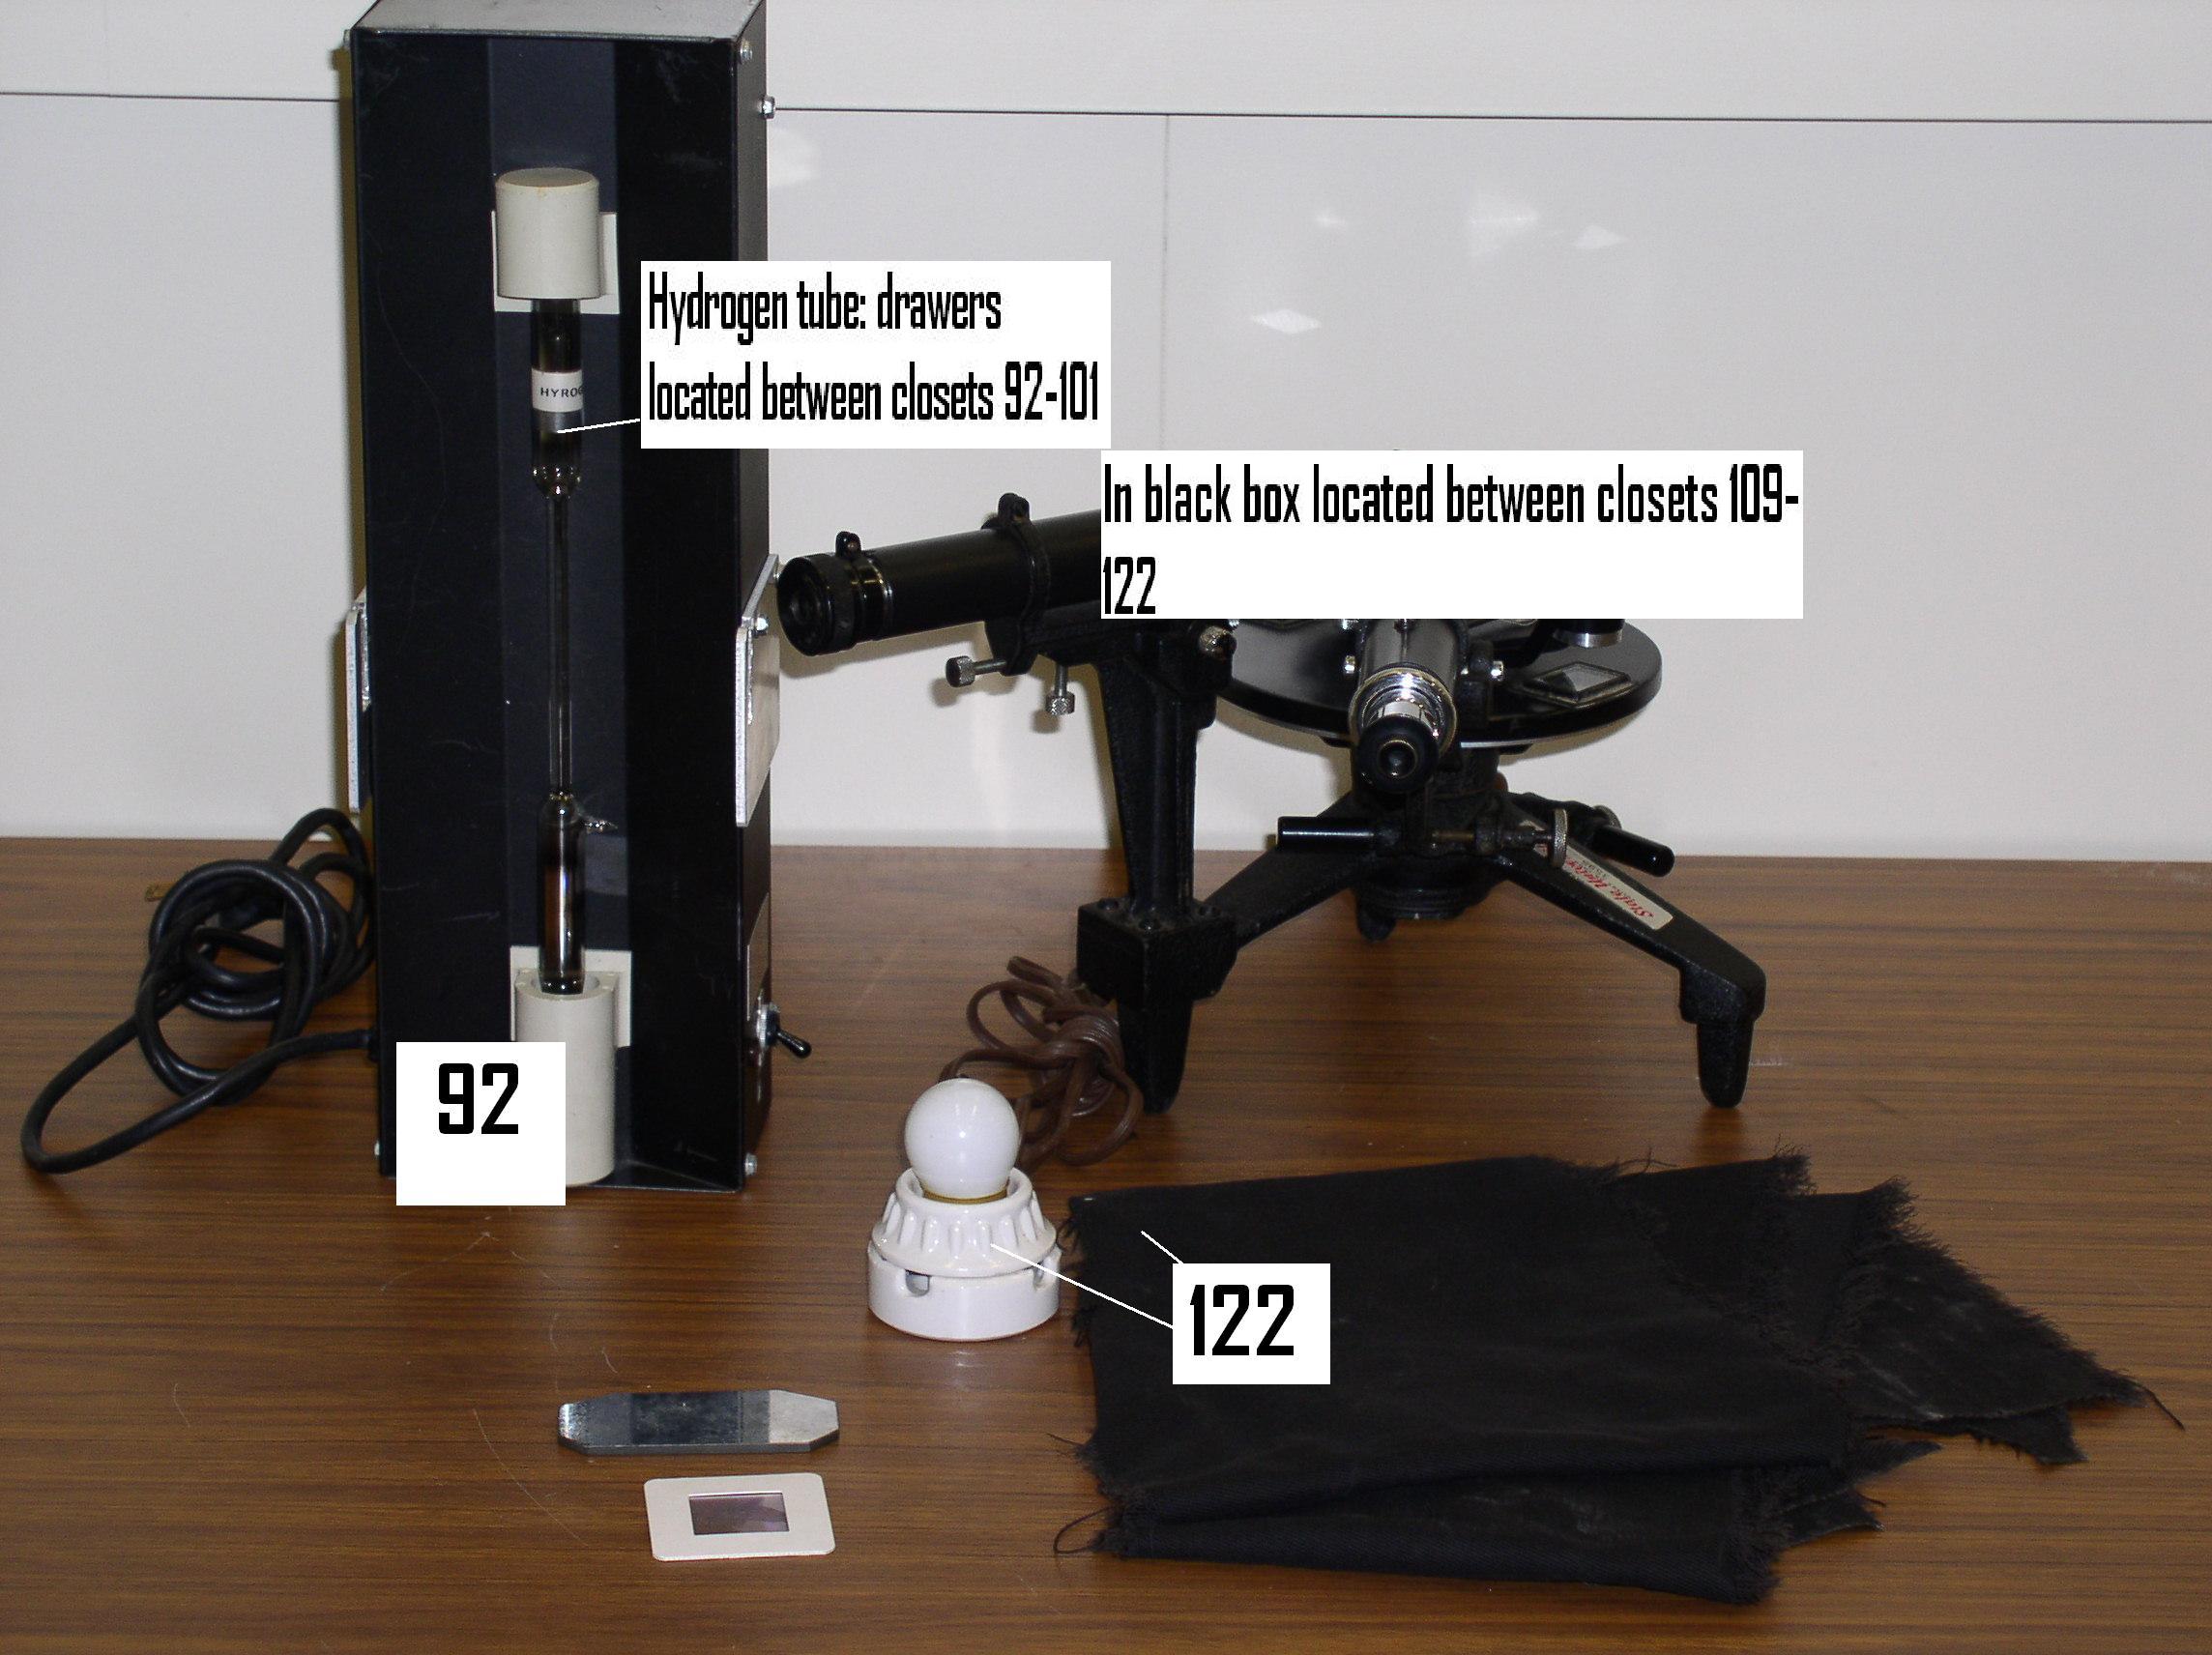
The means for mounting the grating, obtaining parallel rays and measuring the positions of the maxima are provided by the spectrometer table, indicated in the Figure. Light from the source passes through a collimator which consists of a vertical slit and lens. With proper adjustment the collimator can be made to emit parallel rays. This light passes through the grating and is observed in a telescope which has been focused to accept parallel refracted rays. The positions of the various intensity maxima are then determined by noting their position as angles on the vernier scale on the spectrometer table.
Alignment
It is crucial for the success of this experiment that the spectrometer is aligned accurately. Your TA will show you how to do this. The steps are the following:
- Adjustment of telescope: Adjust the telescope so that it focuses parallel rays, by observing some distant object. This includes adjusting the eyepiece to insure that the image of the distant object falls right on the cross hairs, with no evident parallax.
- Adjustment of collimator to emit parallel rays: Move the telescope until you are looking directly into the collimator. Adjust the collimator until you obtain a sharp image of the collimator slit.
Measurement
The spectrometer is now ready to measure wavelengths; make sure you understand how to read the vernier scale for the angles (Some instructions or a YouTube Video explaining how). Place the hydrogen source so that the light falls into the collimator. Insert the grating in its slot after reading off the spacing d. Now slowly change the angle setting of the telescope until you see a line. Read the angle. Continue until you see the next line (it will have a different color) and so on. You should see three different colors. The first one is actually most difficult to see. If you rotate still further you will see the same sequence of lines appearing again, but much fainter. This is the second order pattern (n=2). Try to see as many lines and orders as possible. Repeat this sequence of measurements on the opposite side of the spectrometer. This gives better precision in the measured angles: for each line and order you have now a pair of measured angles θL<0 and θR>0, and θ=θR−θL2.
Analysis
An empirical relationship of the form:
can be fit to the hydrogen wavelengths (explain why). Plot your values of 1λ versus 1m2. Hint: For the last line you see in a given order m=3 (explain why!). Determine a and b from your graph and, by the equation above with the Rydberg formula for hydrogen, determine Ry . Include an analysis of errors! If you have found multiple lines for the second order, analyze the orders separately. Which order gives the more precise results for Ry? Do they agree? If you have an incomplete spectrum (2 or less lines) for the second order, you cannot properly fit it to find the Rydberg constant. In this case, compare your wavelengths to the ones found in the first order. Do they agree?
