Photoelectric Effect

A phototube is illuminated by light of a known wavelength. Electrons are ejected from the photocathode with some kinetic energy \(K\). They are collected as anode current unless a variable retarding potential \(V \) is large enough to stop the electrons. For a given potential \(V\) all electrons with \(K\) eV will be stopped, and at some value \(V_{0}\) even the fastest electrons with a kinetic energy \(K_{max}\) will be stopped when
$$ K_{max}=h\nu-W=eV_{0} $$with \( \nu\) the frequency of the incident light, and \(W\) the workfunction of the cathode material (derive and explain the meaning of this equation in your lab report). By measuring \( V_{0}\) for different \( \nu\) (wavelengths) one can determine \(h/e\) and, since \(e\) is known, \(h\) .
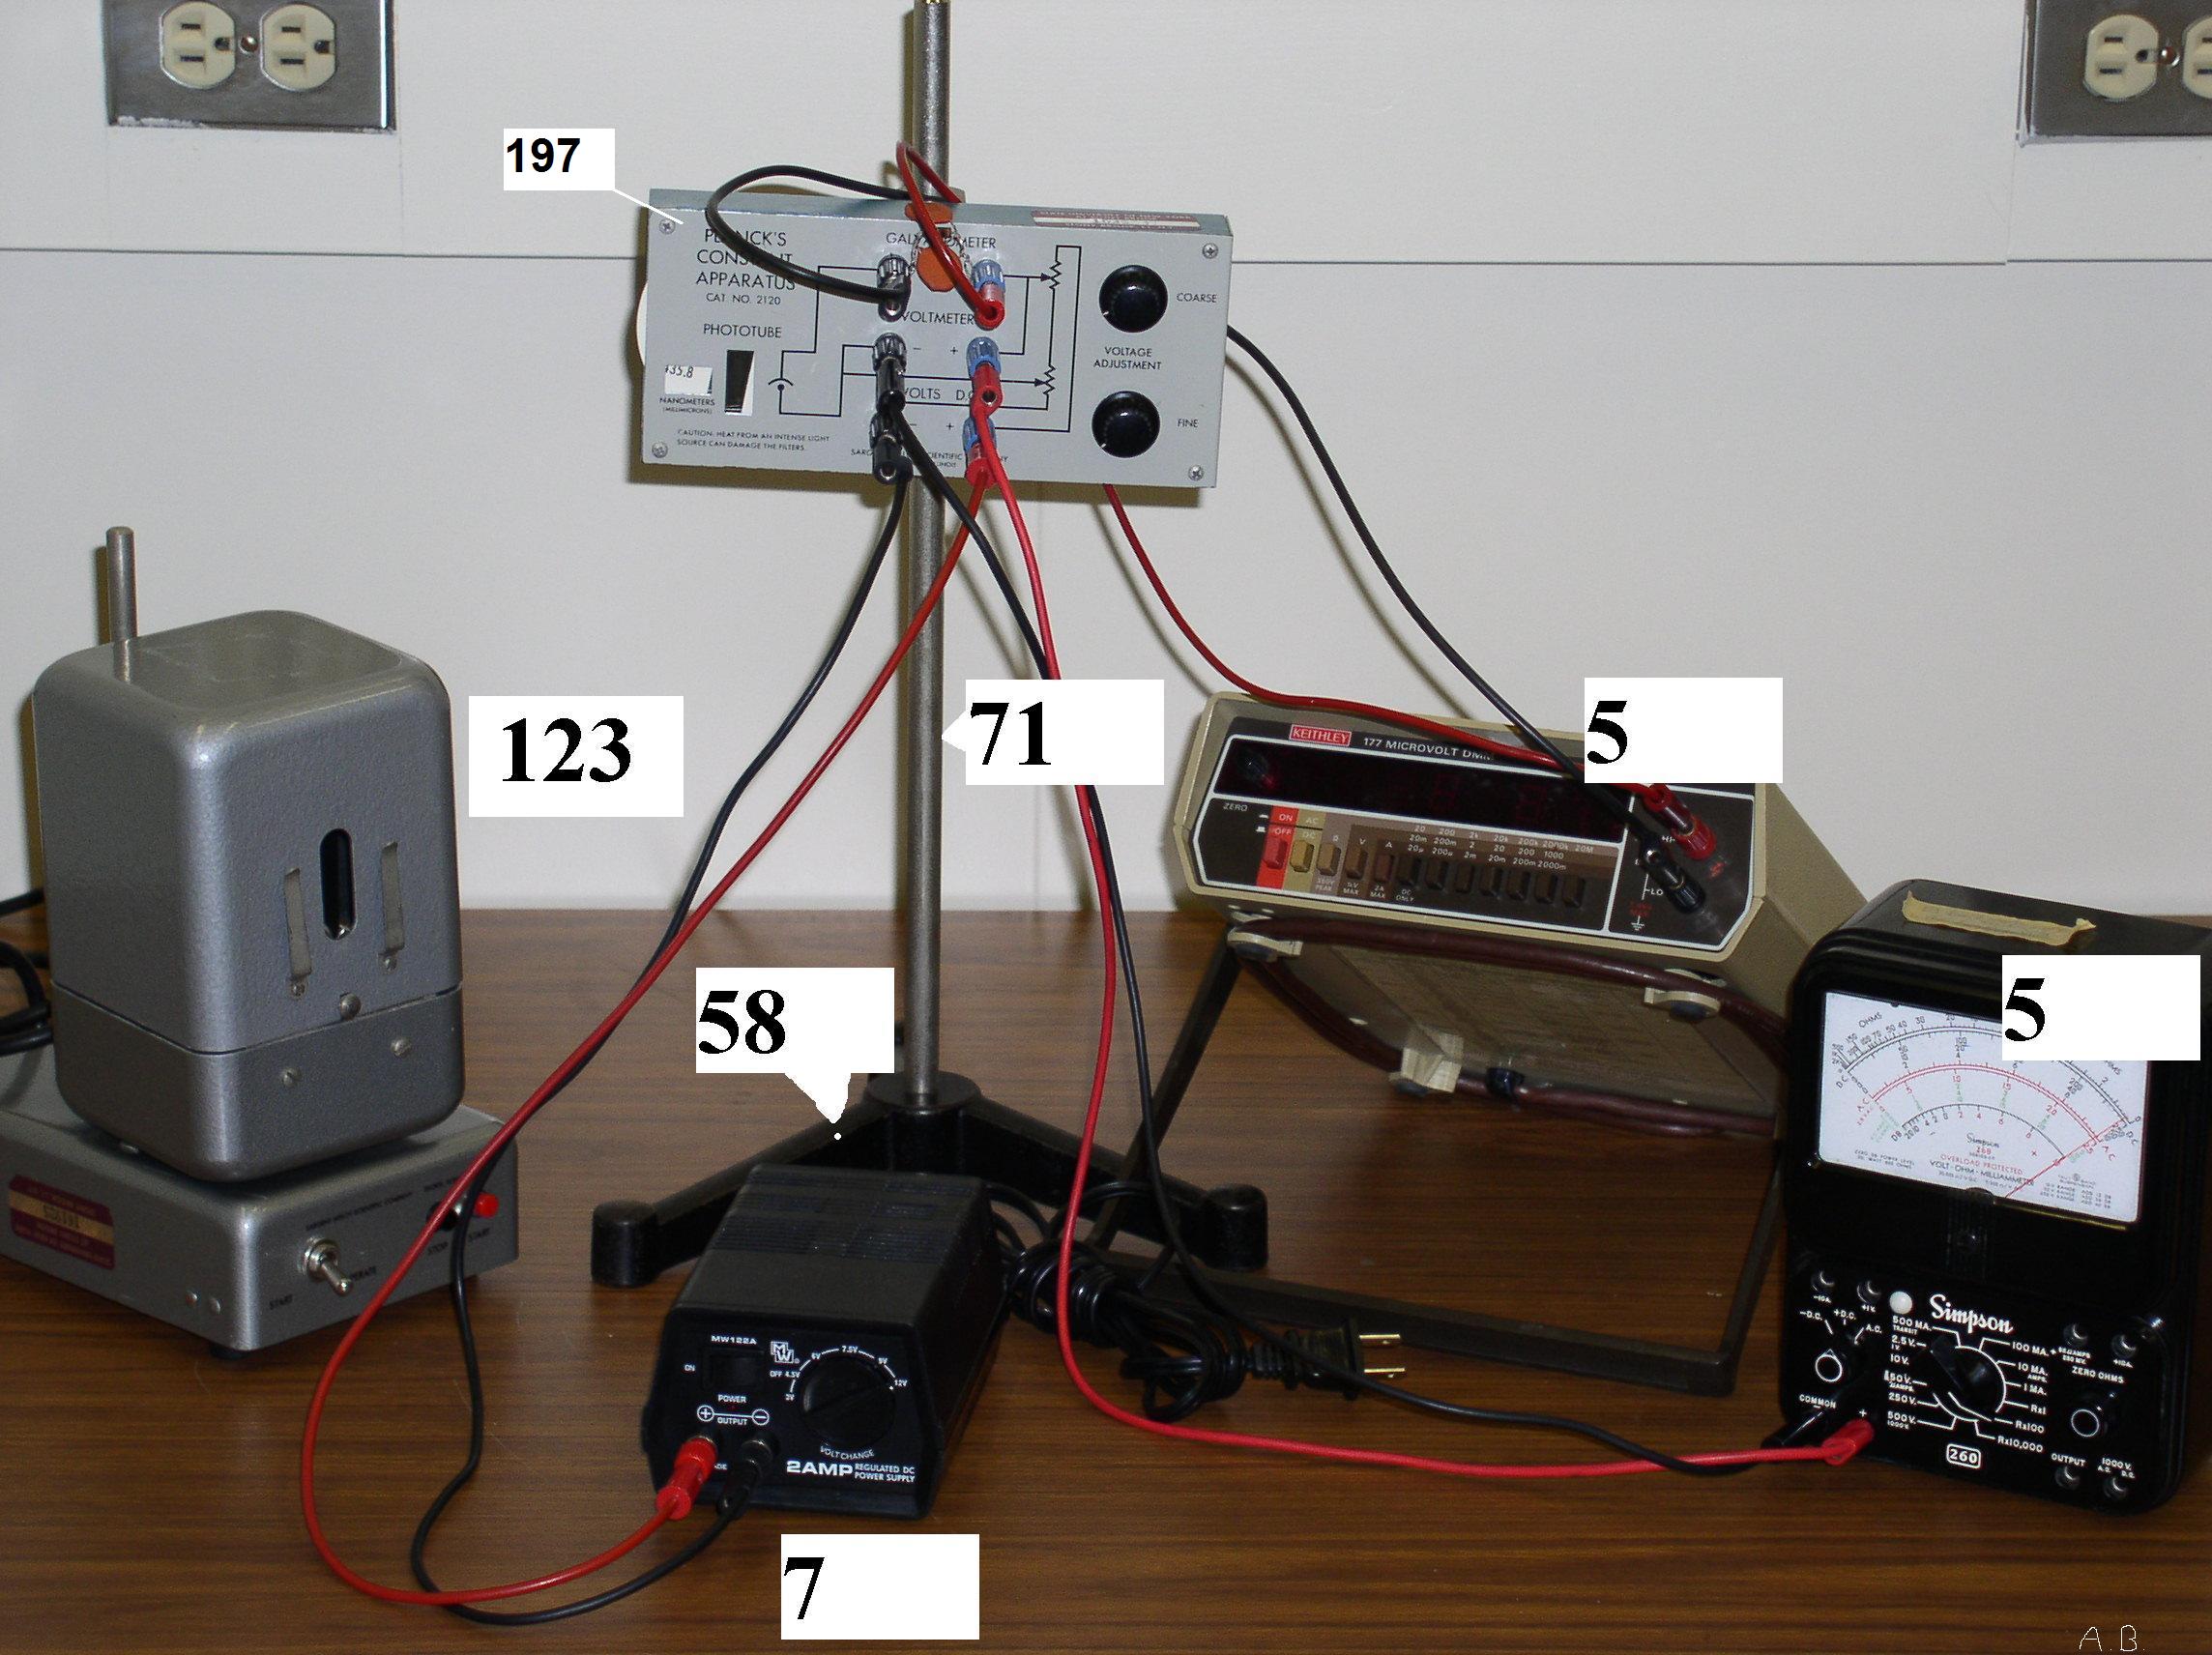
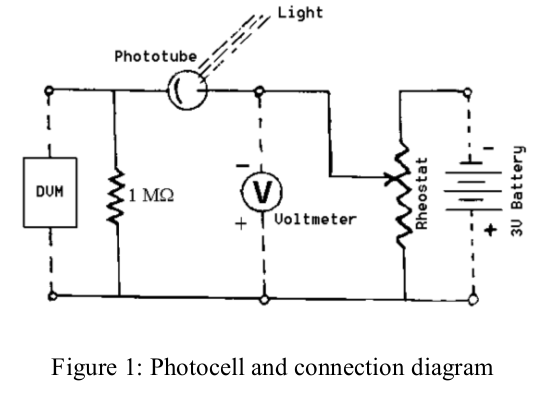
The set-up is sketched in Figure 1 and consists of a phototube, a potentiometer 1 to adjust the retarding voltage, an LED lamp with 3 possible colors 2, a battery to supply retarding voltage, measured by a voltmeter, and a 1 MΩ resistor plus a digital voltmeter (DVM) to read the anode current as a voltage across the resistor.


- Wire the circuit as shown in the Figure. Choose one of the colors and note the wavelength. Switch on the lamp and position it to illuminate the tube. It should be about 10-20 cm distant from the phototube and aligned to give the maximum current reading (voltage on the digital voltmeter). You may need a dark cloth to protect the phototube from room light. Be careful NOT TO CHANGE the distance or alignment between phototube and light source afterwards!
- Vary the retarding voltage from 0 to 3 V in steps of 0.1 V and measure the anode current (determined by the digital voltmeter reading the 1 MΩ resistor). Take this measurement twice for each of the three wavelengths.
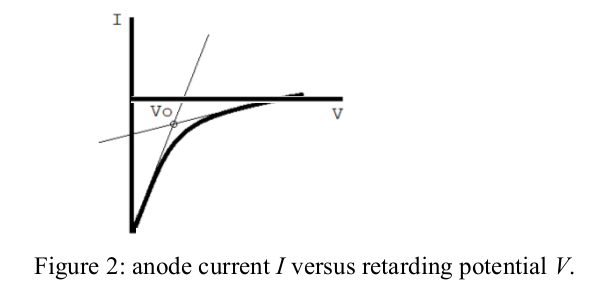
- For each wavelength, determine the stopping potential \( V_{0} \) from a plot of the anode current I versus the retarding potential V (see Figure 2).
- Then plot \( V_{0} \) versus the frequency (three data points). These points should lie on a straight line (see equation 1). Determine \( h/e \) from this line and calculate \(h\). Estimate the error in your values. Compare your result with the accepted value \(h = 6.63×10^{-34} \,\mathrm{Js} \) 3.
- Determine the value of \(W\) for the photocathode.

Click here for details of the analysis
The image above shows a possible \( I \) versus \(V\) curve and one way to determine \(V_0\). Note that:
- Often we measure a curve which comes to a steady, slightly positive current. This comes from paths which can take current from the power supply in the absence of any photocurrent;
- Another way to determine \( V_{0} \) is to say that it is the retarding voltage when the photocurrent reaches zero and, so, the curve reaches the steady positive current. This can be found from the graph in different ways: the best method and best means to determine experimental uncertainty are debated in the literature.
Hovering over these bubbles will make a footnote pop up. Gray footnotes are citations and links to outside references.
Blue footnotes are discussions of general physics material that would break up the flow of explanation to include directly. These can be important subtleties, advanced material, historical asides, hints for questions, etc.
Yellow footnotes are details about experimental procedure or analysis. These can be reminders about how to use equipment, explanations of how to get good results, troubleshooting tips, or clarifications on details of frequent confusion.
Previous manuals called this a rheostat but it is a "pot"
Previously the light source was a mercury arc light source with different color filters
An APS article on Millikan's measurement
The value of h is now (as of 2017) fixed. See Meet the Constants from NIST
Chapter references are for "Modern Physics for Scientists and Engineers, 4th Edition" by Stephen Thornton and Andrew Rex, Cengage Publishing. Photoelectric Effect Section 3.6