
Resonance
In this lab, we will measure the response of an LRC circuit to a sinusoidal input voltage.
We will begin by plotting out the response to varying voltages in order to observe a resonance peak.
We will then observe the relative phases of the voltage across the various components compared to the phase of the input signal.Hoveroverthese!
- 1 Oscilloscope and 1 Function Generator
- 1 Solenoid Coil, 1 Variable Resistor and 1 Variable Capacitor
- Banana cables (8) and alligator clips (8)
- Resonance Plotting Tool
- Record data in this Google Sheets data table
General Resonance
Suppose we have a time-dependent quantity \(Q(t)\) which obeys the differential equation:
$$Q''(t)+\gamma Q'(t)+\omega_0^2 Q(t)=F(t)\label{ForcedOscillator}$$Here, \(\gamma\) and \(\omega_0\) are parameters of our system (constant in time), and \(F(t)\) is some sort of an "input." Typically, for ease of analysis, we choose this to be a sinusoid with a frequency \(\omega\):1
$$F(t)=F_0\sin(\omega t)\label{resinput}$$In general, the solution to our equation is more complicated than this, but all solutions will converge to this particular solution.
For our form of \(F(t)\), we have an explicit particular solution to \(Q(t)\):2
$$Q(t)=-B\cos(\omega t-\phi)\label{ressoln}$$ $$B=\frac{F_0}{\sqrt{(\omega^2-\omega_0^2)^2+\gamma^2\omega^2}}$$ $$\phi=\arctan\left(\frac{\omega_0^2-\omega^2}{\gamma\omega}\right)\label{phase}$$We note that, if \(\gamma\) is not too large (\(\gamma\ll\omega_0\)), the response is approximately largest when the input frequency is set at \(\omega\simeq\omega_0\); this relationship becomes exact if we instead look at \(Q'(t)\), which oscillates with amplitude \(B\omega\).3 This phenomenon is called resonance.41
Full Solution (Driven Damped Oscillators)
While it's fairly easy to show that the above solution is a solution to the differential equation, you might worry about whether it's the right solution. That's because we present one "long-term-stable" solution, not the full solution.
Let's call the "particular solution" presented above \(Q_p(t)\), and call the "full solution" \(Q(t)\) (which we don't yet know). Now, let's consider the behavior of the function \(Q_h(t)=Q(t)-Q_p(t)\), known as the "homogeneous solution."
This function solves the equation:
$$Q_h''(t)+\gamma Q_h'(t)+\omega_0^2 Q_h(t)=0$$Hence, \(Q_h(t)\) is a solution to the not-driven oscillator. We have an explicit solution for such a situation (see the expandable "LRC Circuits" section of the Inductors lab), and it is possible to show that this solution is fully general (because we can account for any initial condition).
The relevant result we can take is that all such solutions decay exponentially (in amplitude, if oscillatory), at rate approximately \(\gamma\). Therefore, if we wait sufficiently many cycles (many times longer than \(\gamma^{-1}\)), we expect these solutions to decay to approximately zero.
This allows us to conclude that any solution to the differential equation will approach the particular solution we chose above, as stated above.
Electrical Resonance
In an LRC circuit driven by an AC current \(V(t)=V_0\sin(\omega t)\), we let \(Q(t)\) represent the charge on the capacitor. Then, the differential equation obeyed becomes:
$$LQ''(t)+RQ'(t)+\frac{1}{C}Q(t)=V(t)\label{VoltEq}$$Dividing through by \(L\), we find that the above general characterization applies here if we let:
$$\gamma=\frac{R}{L}\qquad\qquad \omega_0^2=\frac{1}{LC}\qquad\qquad F_0=\frac{V_0}{L}\label{ForwardFormulas}$$In fact, when we plot the resonance curve in this lab, we measure not \(Q(t)\) (or its derivatives) directly, but rather the voltage across the resistor, \(V_R=IR=RQ'(t)\). Then, our solution (in terms of the same parameters) takes the form (for the same \(\phi\)):
$$V_R(t)=A\sin(\omega t-\phi)$$ $$A=\frac{V_0\gamma\omega}{\sqrt{(\omega^2-\omega_0^2)^2+\gamma^2\omega^2}}=\frac{V_0}{\sqrt{\frac{1}{R^2}\left(L\omega-\frac{1}{C\omega}\right)^2+1}}$$The magnitude of the response as a function of input frequency, \(A(\omega)\), defines a resonance peak.2 The quantities \(X_L=L\omega\) and \(X_C=\frac{1}{C\omega}\) are called the inductive and capacitive reactances, respectively (both of which are measured in Ohms).5
The phase \(\phi\), which can still be calculated using equation \eqref{phase}, represents the amount which the output (across the resistor) lags behind the input.6
Unfortunately, based on the shape of this voltage peak alone, we cannot extract any of \(R\), \(L\), or \(C\) themselves. However, we can calculate certain combinations, and if we know some of the circuit components, then we can calculate the others.
Complex Impedance (not necessary, but perhaps useful if you know complex numbers)
When analyzing AC circuits, it is frequently useful to use a quantity known as impedance.
For an input with a frequency \(\omega\), each basic circuit component (resistor, capacitor, inductor) have an impedance \(Z\), with units of Ohms. For a resistor, \(Z=R\); for a capacitor, \(Z=-iX_C\); and for an inductor, \(Z=iX_L\). (This is why some conventions define \(X_C\) as negative.)
When combining circuit components, in series, impedances add; in parallel, their inverses add (i.e., they act like resistances).
Their use is as follows. Suppose we have a \(V(t)=V_0\cos(\omega t)\), as before. Suppose we "complexify" this, and write \(V(t)=V_0e^{i\omega t}\), where the real part of \(V(t)\) is the "physical" voltage.
Suppose we do the same with current: consider \(I(t)\) to be the real part of some oscillation \(I=I_0e^{i\omega t+\phi}\). (Note this means \(Q(t)=\frac{I_0}{i\omega}e^{i\omega t+\phi}\).)
Then, we can plug \(Q(t)\) into equation \eqref{VoltEq}, and observe that we get an equation analogous to Ohm's law:
$$V(t)=I(t)Z$$Then, it's a fairly simple algebraic exercise (with complex numbers in polar coordinates) to find both the \(B\) and \(\phi\) given above.
If you want to understand the math behind this approach in more detail, you should look into Fourier analysis. What we essentially do in this approach is Fourier transform both sides of equation \eqref{ForcedOscillator}, and solve the (much simpler!) equation that arises.
Part I: Plotting the Resonance Peak
First, check that you have a 1Ω resistor across the ports of your function generator.7
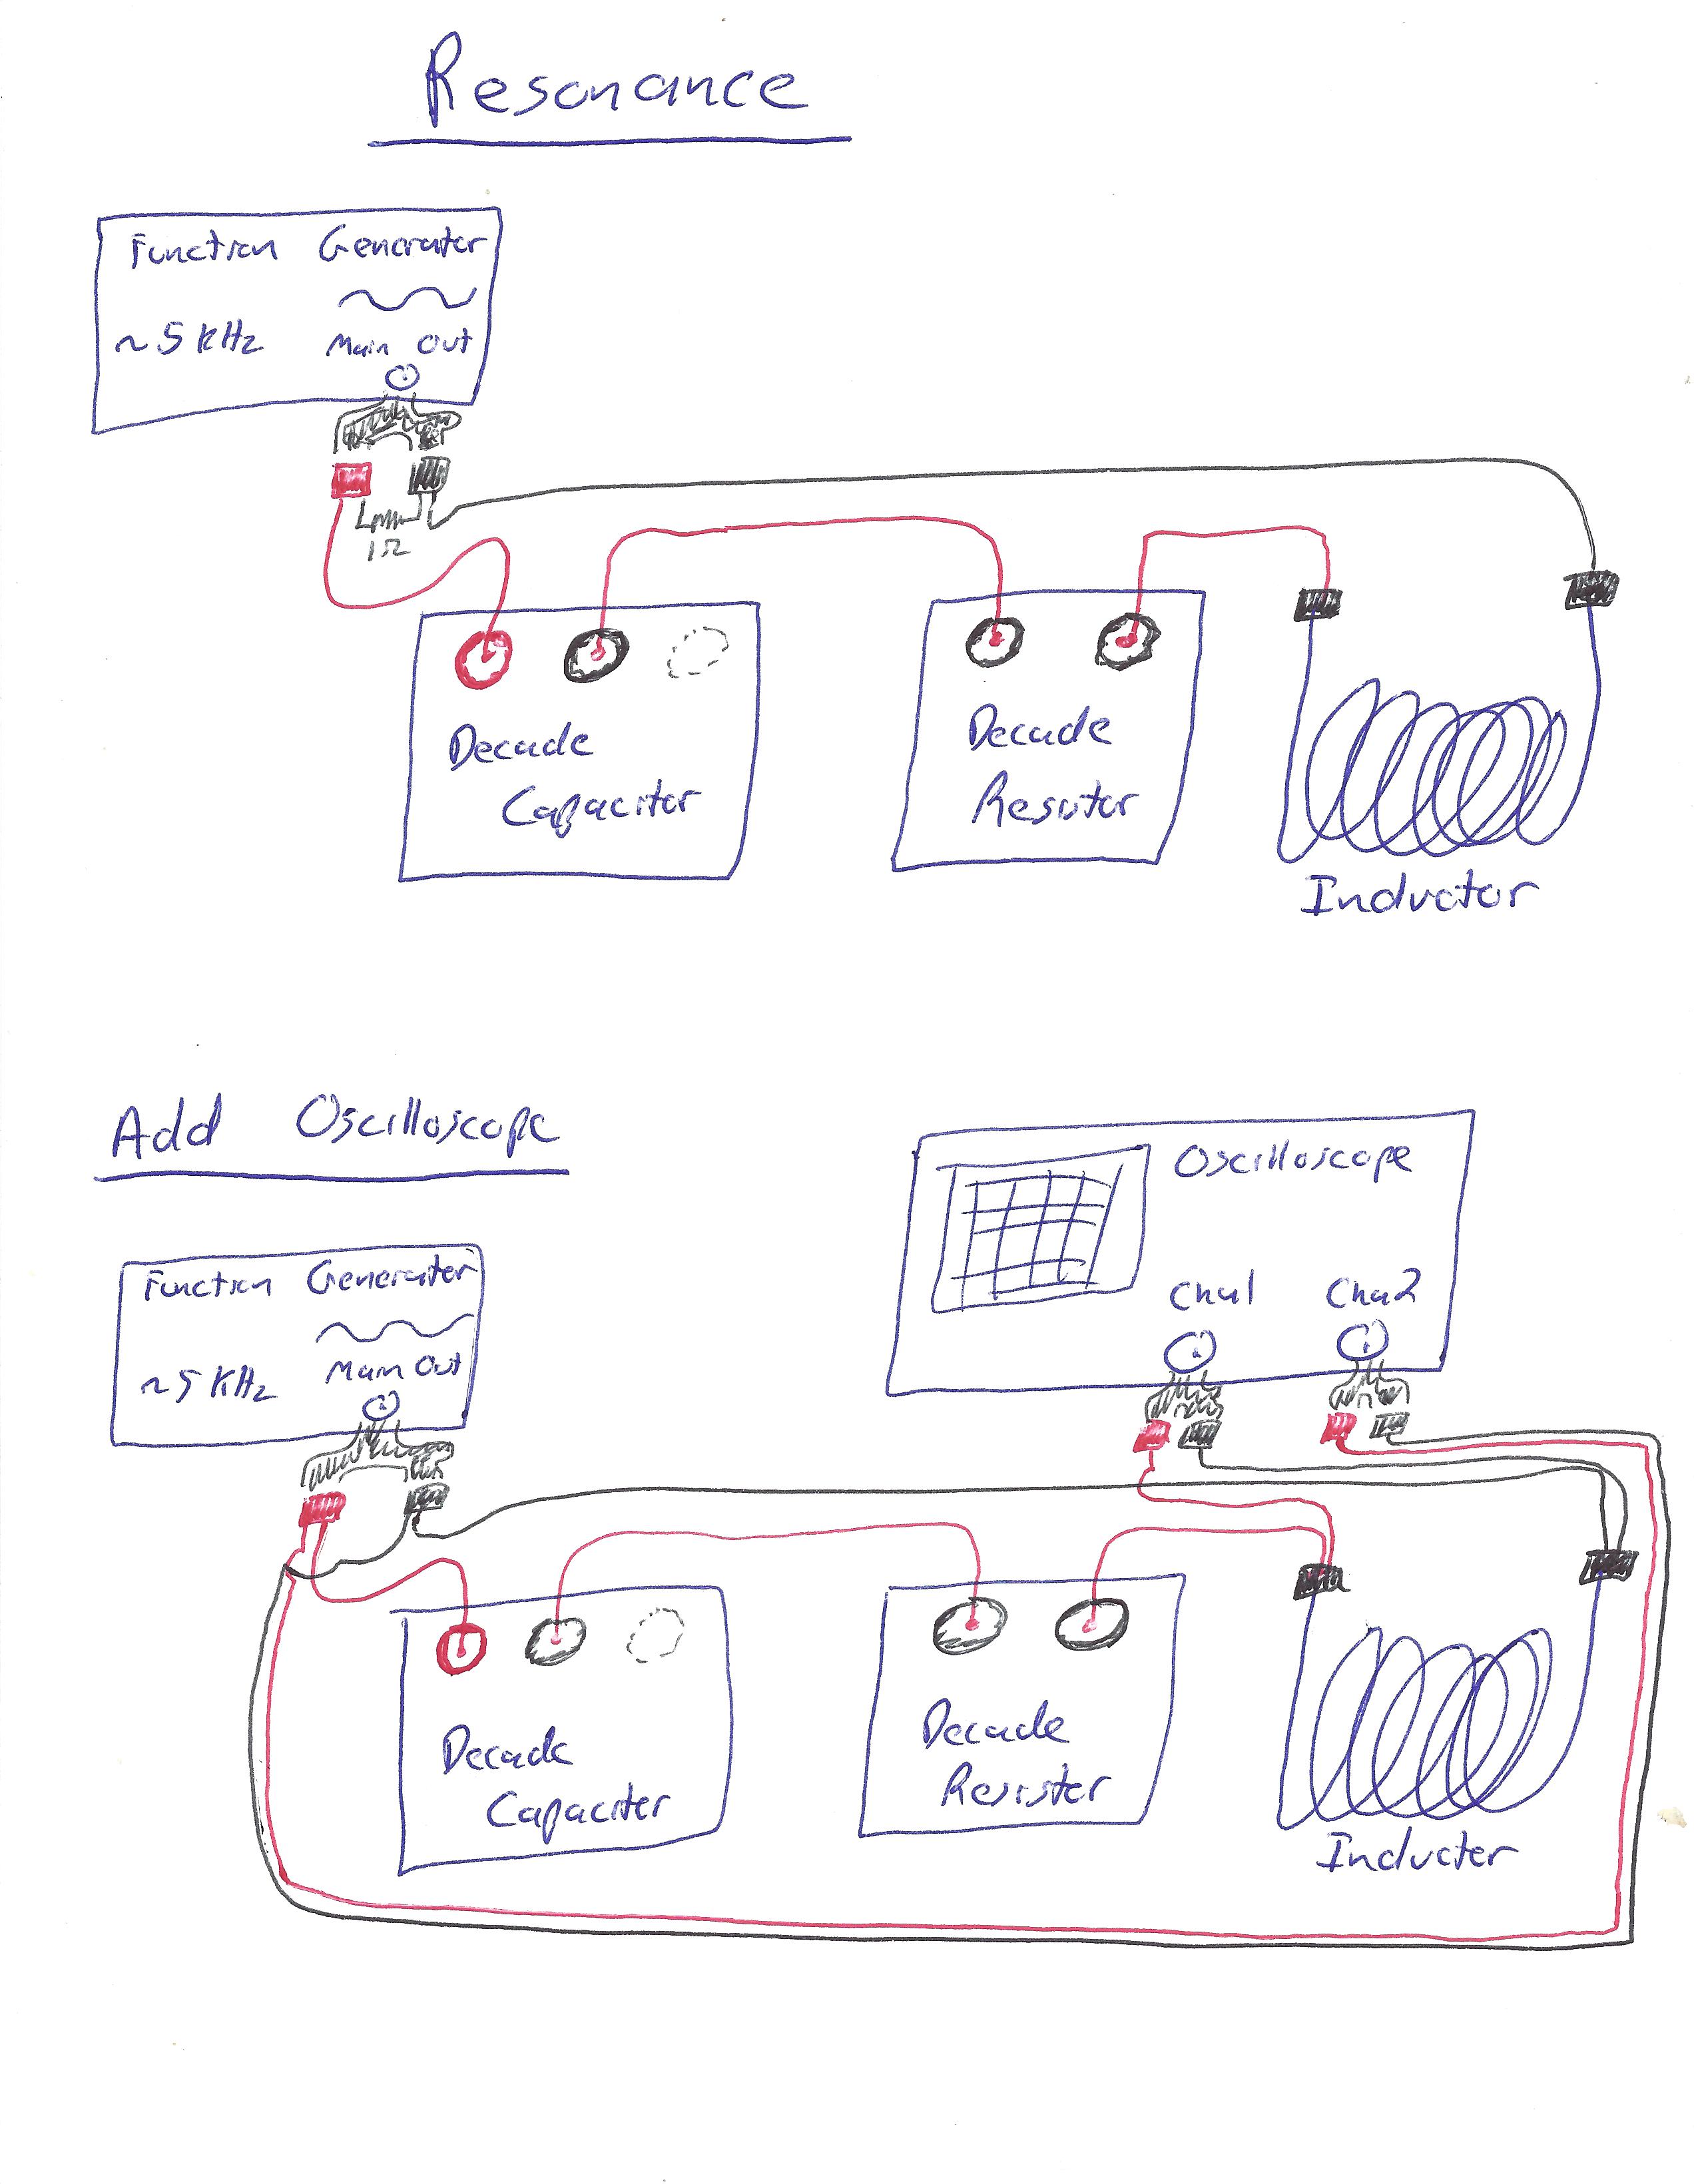
Then, wire up an LRC circuit, with the oscilloscope across the resistor, as follows:1
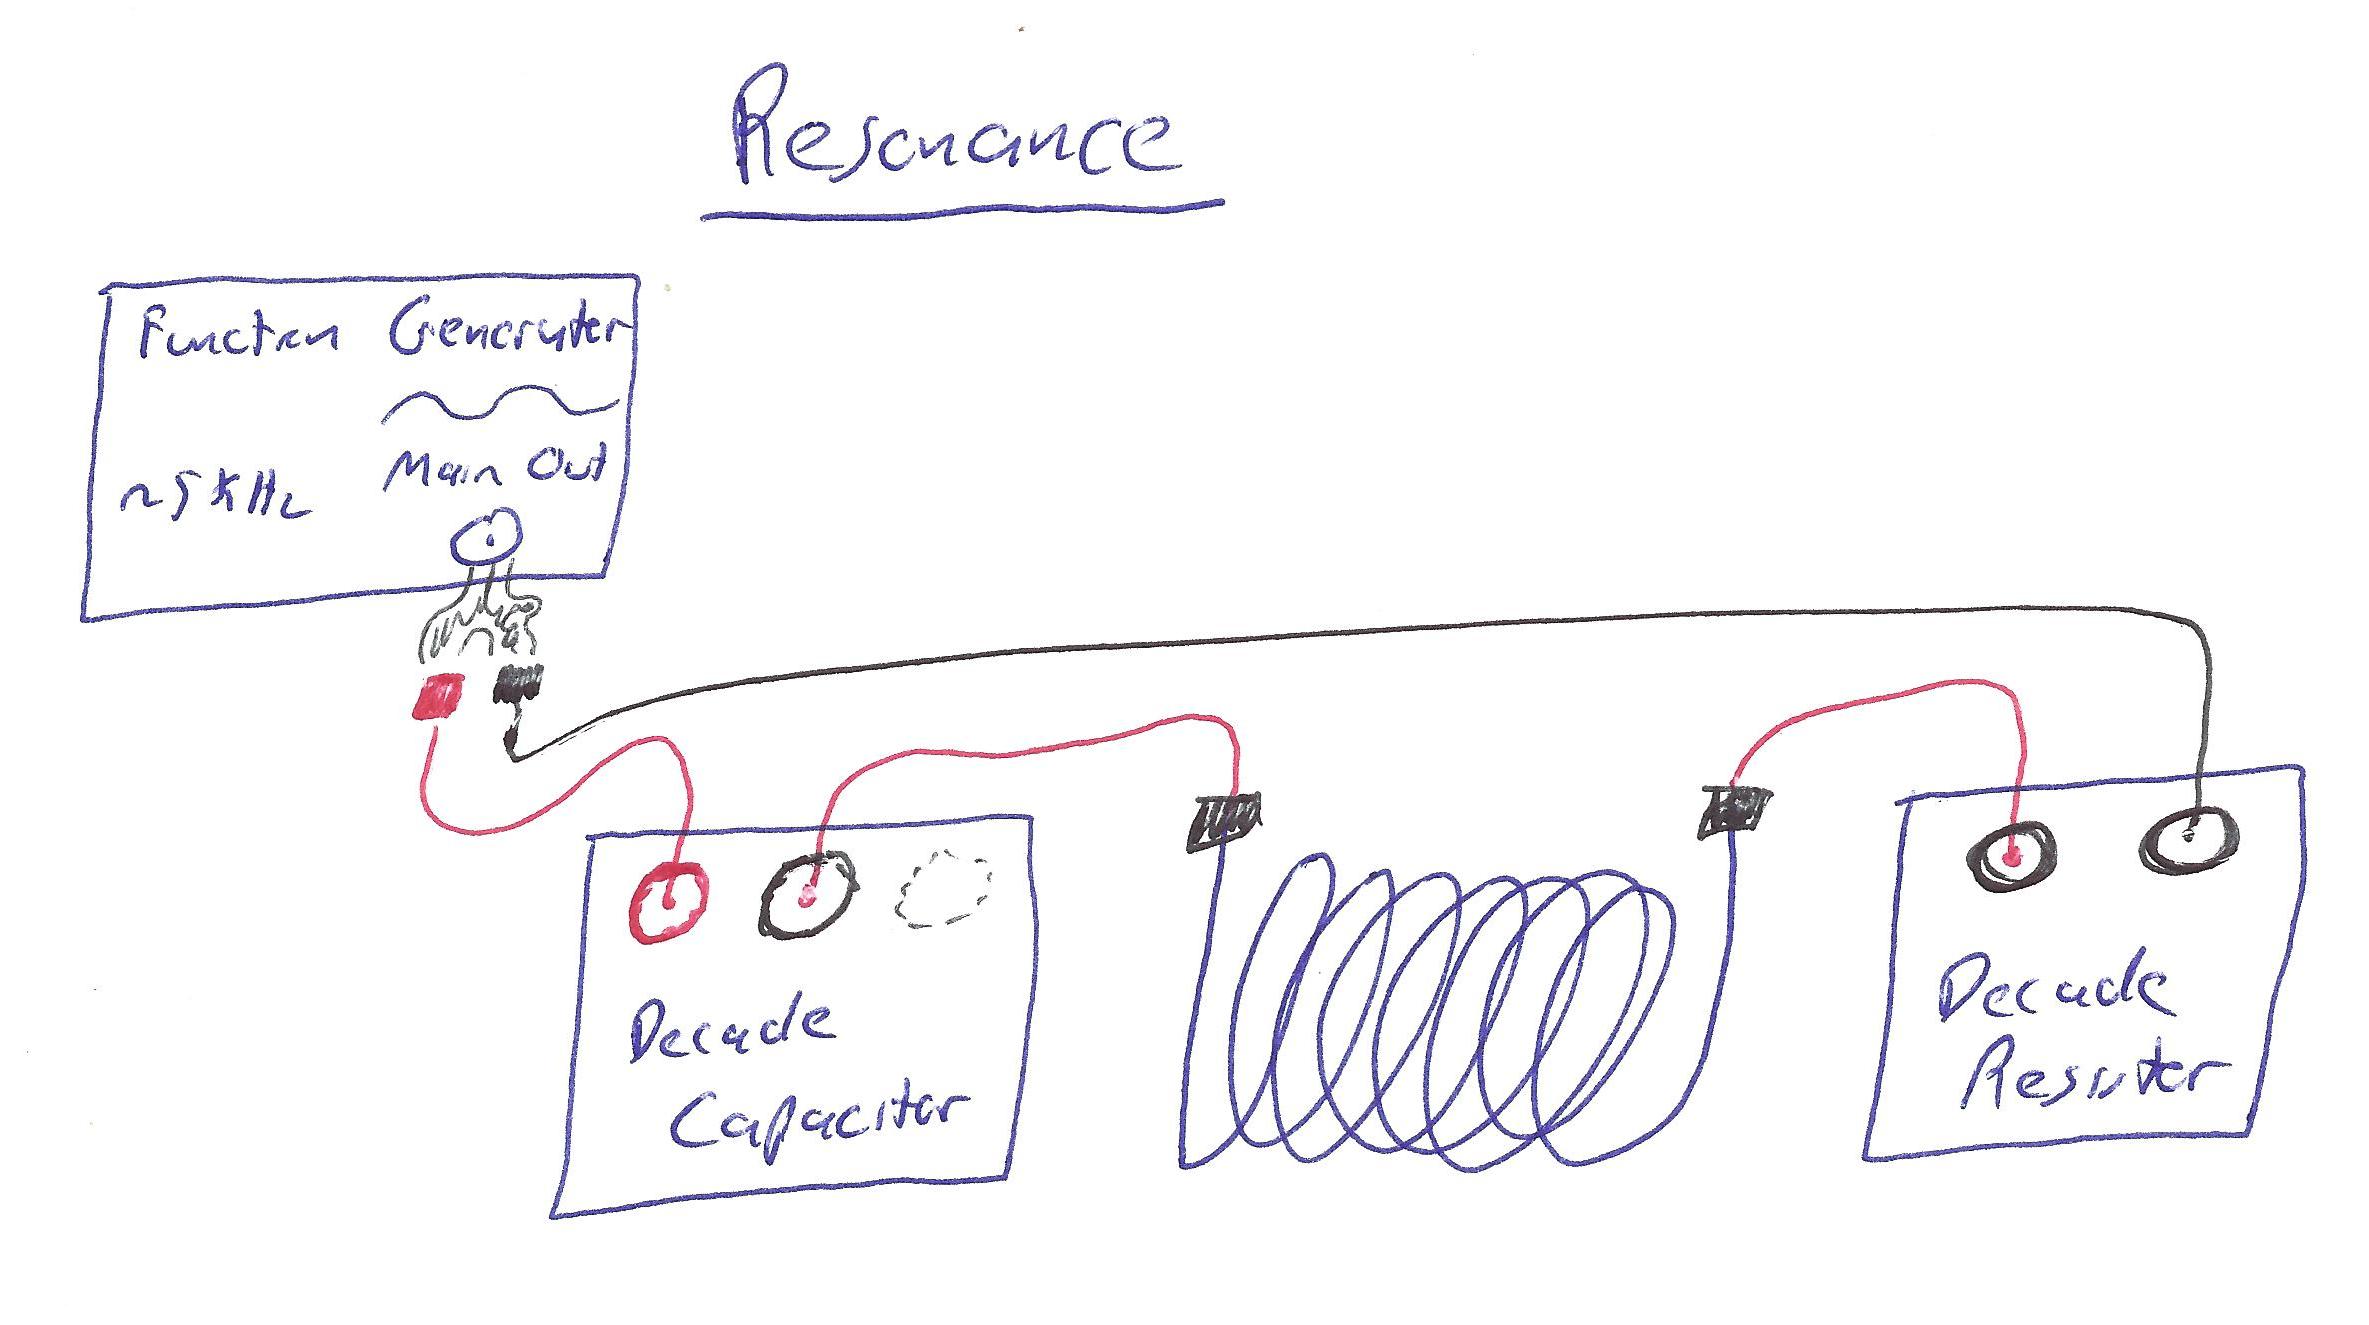
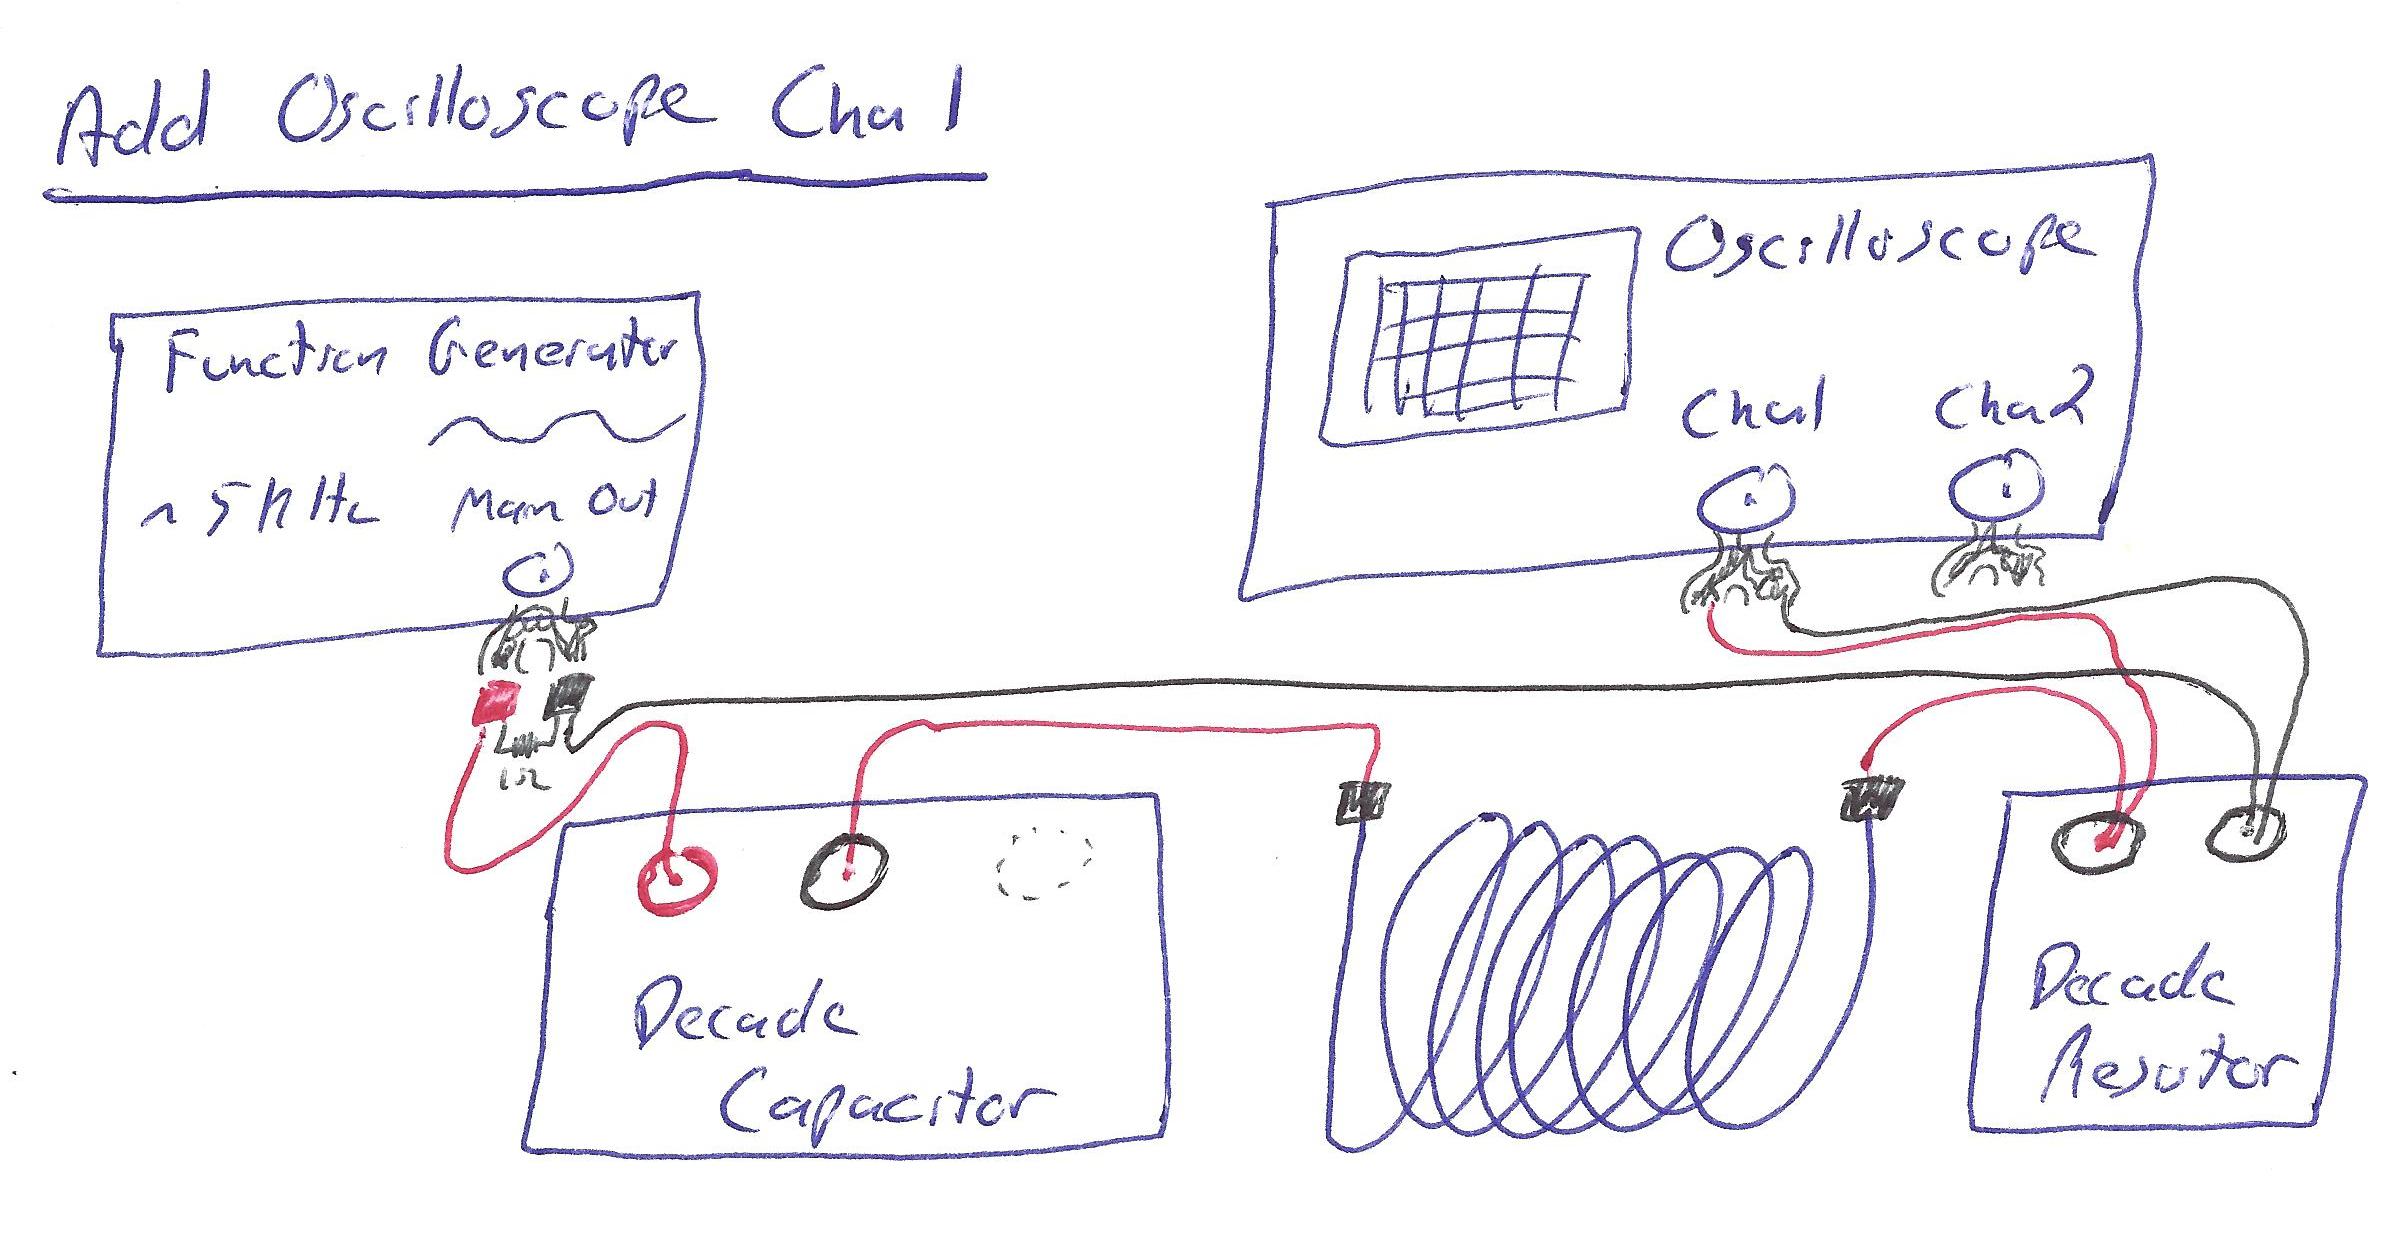
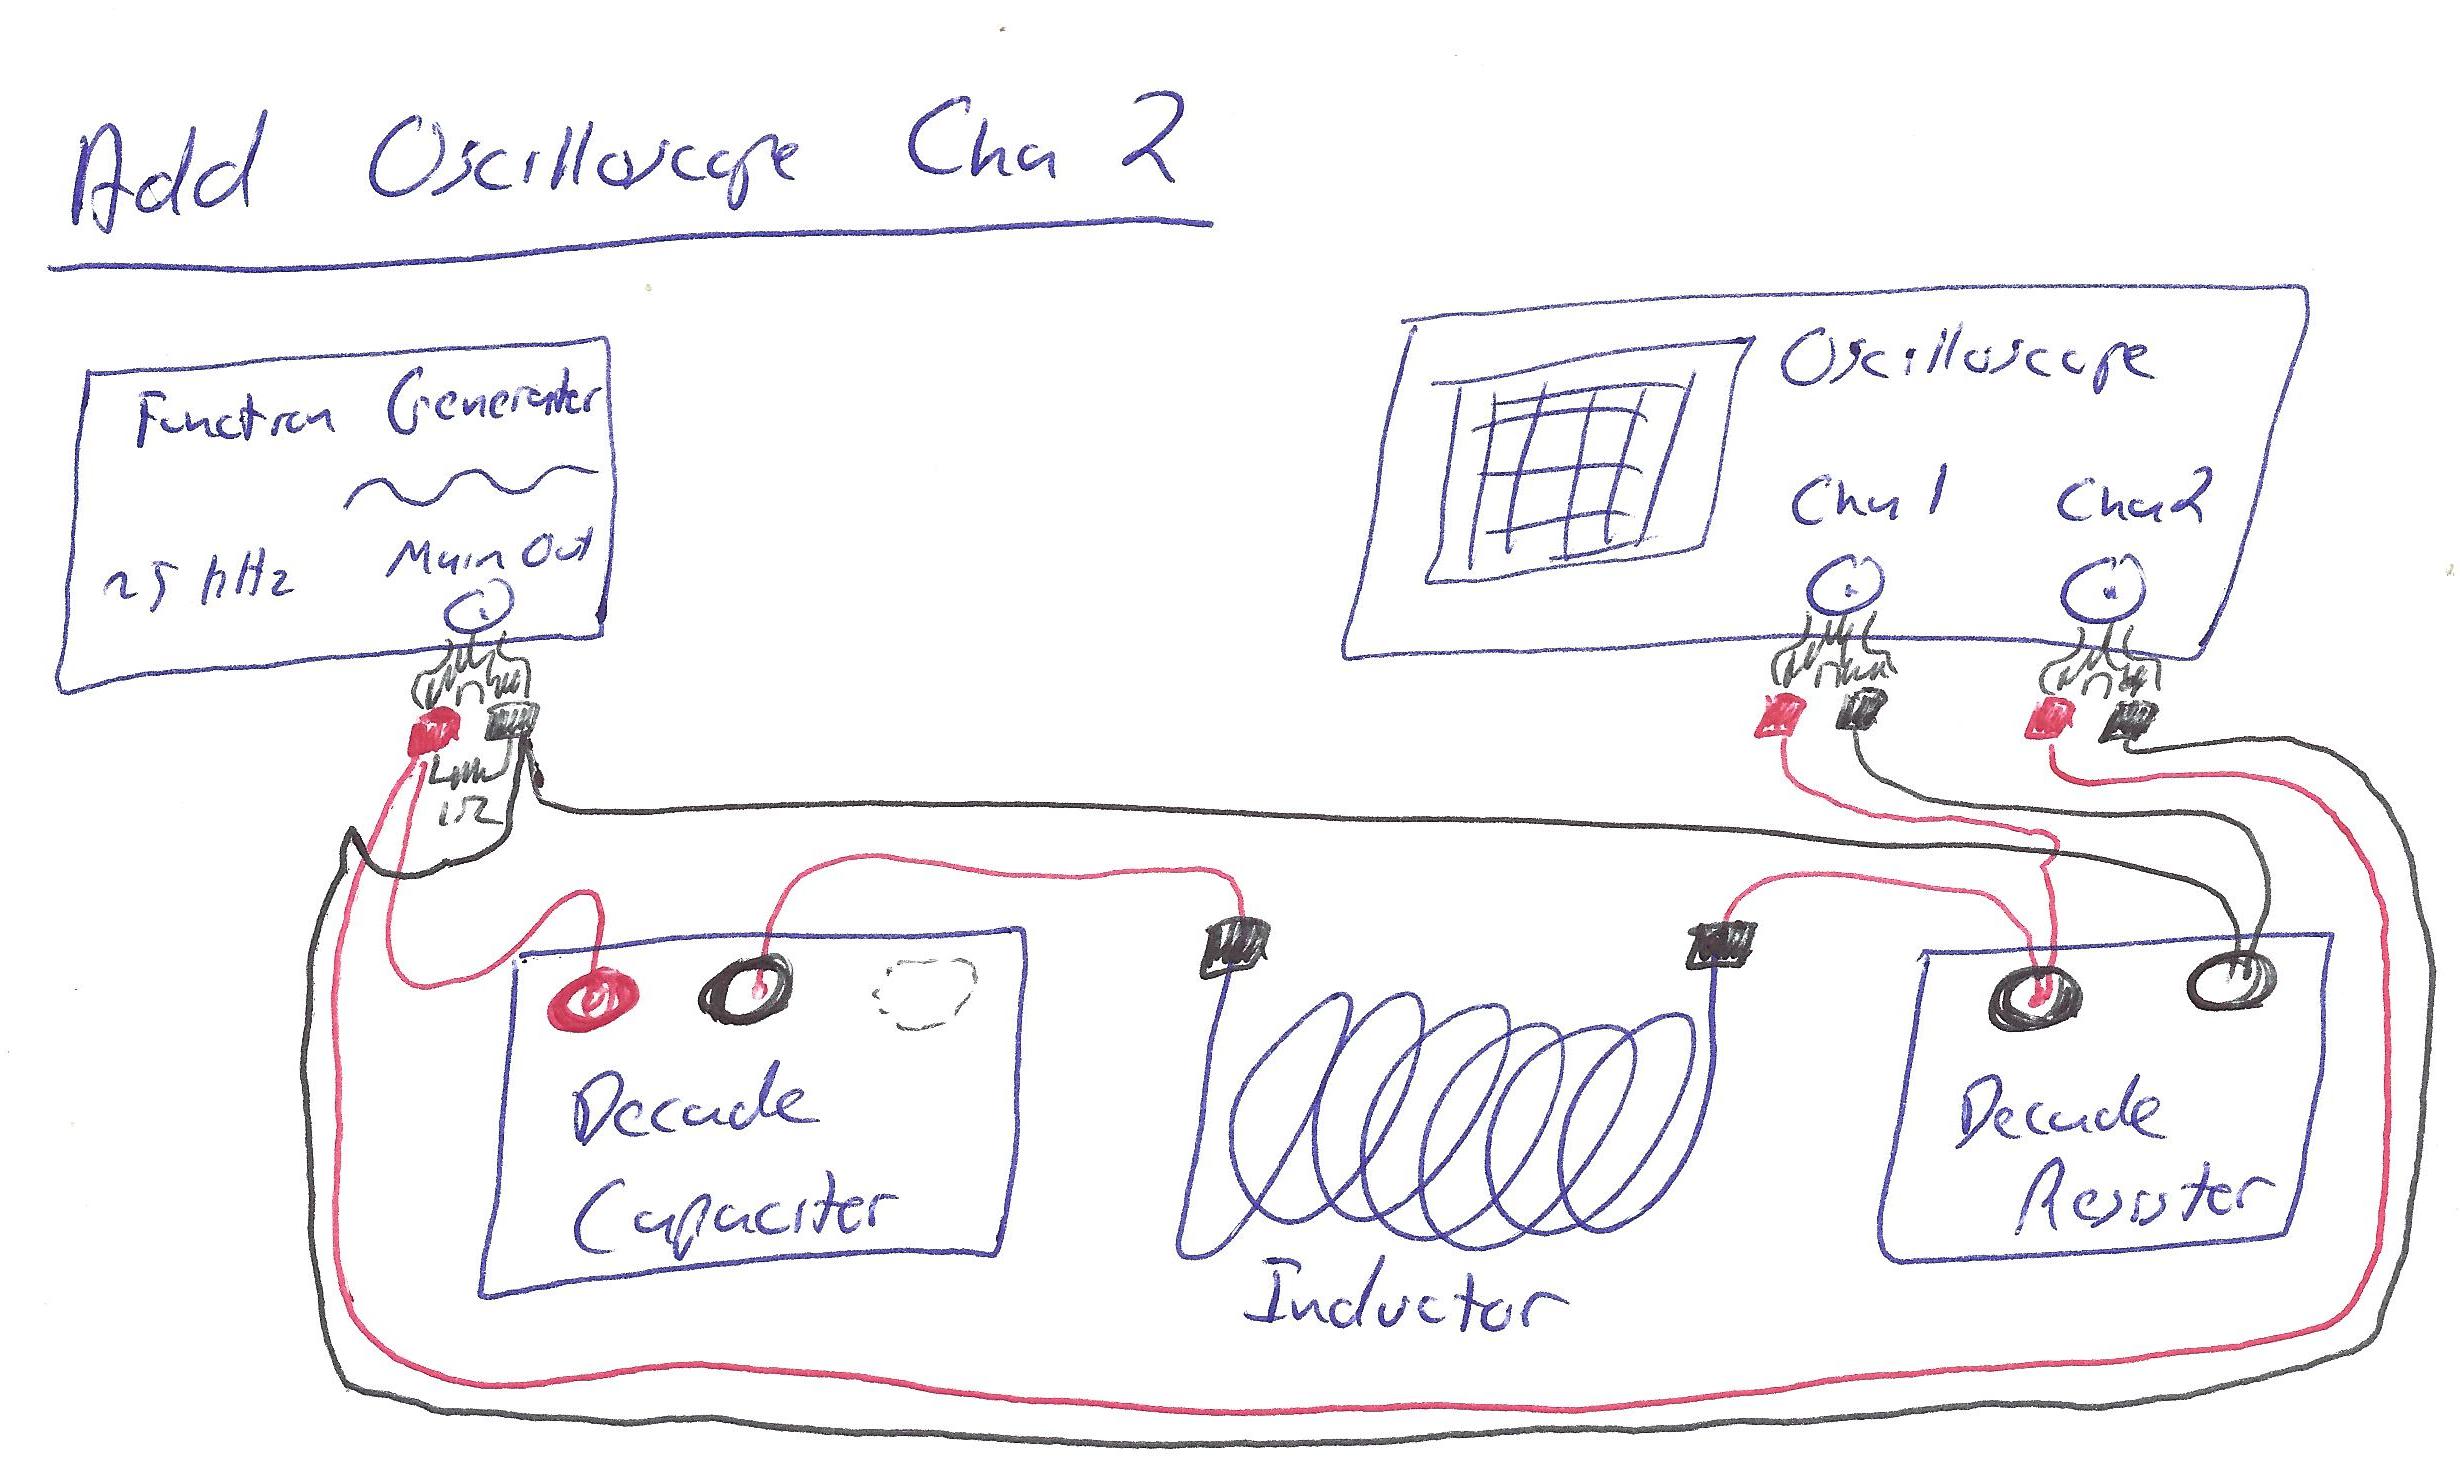
Click here for wire-by-wire instructions.
(For simplicity of using these instructions, orient the inductor so that it has one terminal on the "left side" and one on the "right side," relative to each other.)
We assume you are starting with no wires connected:
- Begin by wiring a red wire from the red terminal on the function generator to the red terminal of the variable capacitor.
- Run a (red) wire from the black terminal of the capacitor to the left-hand side of the inductor.
- Run a (red) wire from the right-hand side of the inductor to the red terminal on the variable resistor.
- Run a black wire from the black terminal on the variable resistor back to the black terminal on the function generator.
You should now have a complete circuit.
- Connect a red wire from the red terminal on CH1 of the oscilloscope to the red terminal on the resistor.
- Connect a black wire from the black terminal on CH1 of the oscilloscope to the black terminal on the resistor.
CH1 of the oscilloscope should now be wired across the resistor.
- Connect a red wire from the red terminal on CH2 of the oscilloscope to the red terminal on the function generator.
- Connect a black wire from the black terminal on CH2 of the oscilloscope to the black terminal on the function generator.
CH2 of the oscilloscope should now be wired across the function generator. This completes the circuit.
Set your resistor to a resistance of 50Ω and your capacitor to a capacitance of 0.1μF (record these quantities). Then, set your function generator to output an approximately 5kHz sine wave with a reasonable amplitude.
Set your oscilloscope to trigger on CH2, and look at your CH2 signal. Adjust your oscilloscope settings to optimally observe the sine wave your function generator is outputting.
Click here as a reminder reasonable starting oscilloscope settings.
The following knobs must be set as listed:
- POWER: Pushed in (duh)
- VAR knobs and VAR SWEEP: calibrated (most clockwise) position
- SOURCE: CH2 (we want to trigger on the function generator for a more reliable input)
- VERT MODE: CH2 (initially; will become CH1)
- COUPLING: AC
- AC GND DC (both channels): Set to DC
- XY, STORAGE/ANALOG, all buttons in bottom-left: pushed out
The following settings are a suggested starting place to get a reasonable picture, but you can more-or-less tweak these freely:
- TRIGGER LEVEL: middle position, pushed in
- INTENSITY, FOCUS: middle position
- POS knobs (both channels and time): middle position
- VOLTS/DIV: 1V (will vary depending on amplitude setting chosen & over course of experiment)
- TIME/DIV: 0.1ms
If those are set as such, your oscilloscope is plugged in, and you're still not seeing something reasonable, consult your TA.
Using your oscilloscope, record the (center-to-peak) amplitude of your driving sine wave, \(V_0\) (with uncertainty)2.
Now, flip to observing CH1 (but still trigger on CH2). Let's first get a preliminary measurement of resonant frequency by eye: adjust your frequency until you find the frequency at which the voltage looks maximal. Record that value as your estimate of resonant frequency, \(f_{\text{res,est}}\).
Then, vary the frequency, and see over what range of frequencies the CH1 voltage still looks "pretty close to" maximal. Take half that range as your uncertainty in your resonant frequency estimate.
With that done, we'll now use the oscilloscope to take measurements of our (center-to-peak amplitude of) voltage across the resistor. We will use your resonant frequency estimate to get the region of interest.
Begin at \(0.5f_{\text{res,est}}\)3. Take the frequency from our function generator, and record an uncertainty. (If your function generator is fluctuating in frequency, record the typical size of those fluctuations; otherwise, last decimal place.) Then, measure the (center-to-peak) amplitude of the observed voltage from your oscilloscope, and estimate uncertainty (reading uncertainty, as usual). Be sure to adjust your VOLTS/DIV to minimize this uncertainty!
Then, repeat for ten more measurements of amplitude, working your way up to \(1.5f_{\text{res,est}}\) in steps of (approximately) \(0.1f_{\text{res,est}}\)4. Adjust your VOLTS/DIV as you go.5
Now that all of that is done, we're going to repeat the process for two other parameter sets, to see how different capacitance and resistance impacts our resonance curve.
Measurement 2Change the capacitance to 0.200μF, keeping the resistance at 50Ω. Determine the new resonant frequency, \(f_{\text{res,est}}\) by varying the frequency and observing the maximum amplitude on Channel 1.
[Optional! Not required! You may, if you wish, plot out the resonance curve with the new value of capacitance.]
Measurement 3Then, return the capacitance value to 0.1μF [as in the first trial] and set a new resistance of 10Ω.
Determine the new resonant frequency, \(f_{\text{res,est}}\) by varying the frequency and observing the maximum amplitude on Channel 1.
NOT Optional! Required! Plot out the resonance curve from \(0.5f_{\text{res,est}}\) to \(1.5f_{\text{res,est}}\) with the new value of resistance.
Part II: Observing the Phase Shifts
Original SettingsNow, set back to your initial settings: resistance of 50Ω, capacitance of 0.100μF. Set your function generator to the resonance frequency (that you measured by eye) for that R, C combination (ie. Measurement 1).
Change your oscilloscope to DUAL mode to see the input signal and the voltage across the resistor. Record the amplitude of each.
Adjust your horizontal position so that the input signal (CH2) forms a sine function. I.e.: pick some reference point (say, the middle of the screen) to be \(t=0\), and shift your wave left and right until it looks like \(\sin(\omega t)\) (rather than, e.g., \(\cos(\omega t)\).
With this done, record whether the resistor oscillation looks like a \(\sin\), \(\cos\), \(-\sin\), or \(-\cos\) (or something else), considered with respect to the same reference point (for \(t=0\)).
Measuring across the capacitorNext: swap the locations of the resistor and capacitor in your circuit (such that the oscilloscope now measures across the capacitor, and the capacitor is the last element on the "primary loop" to avoid grounding problems). Repeat the measurements you made for your resistor with the capacitor - i.e., measure the amplitude of the capacitance oscillation and whether it's a \(\sin\), \(\cos\), etc.
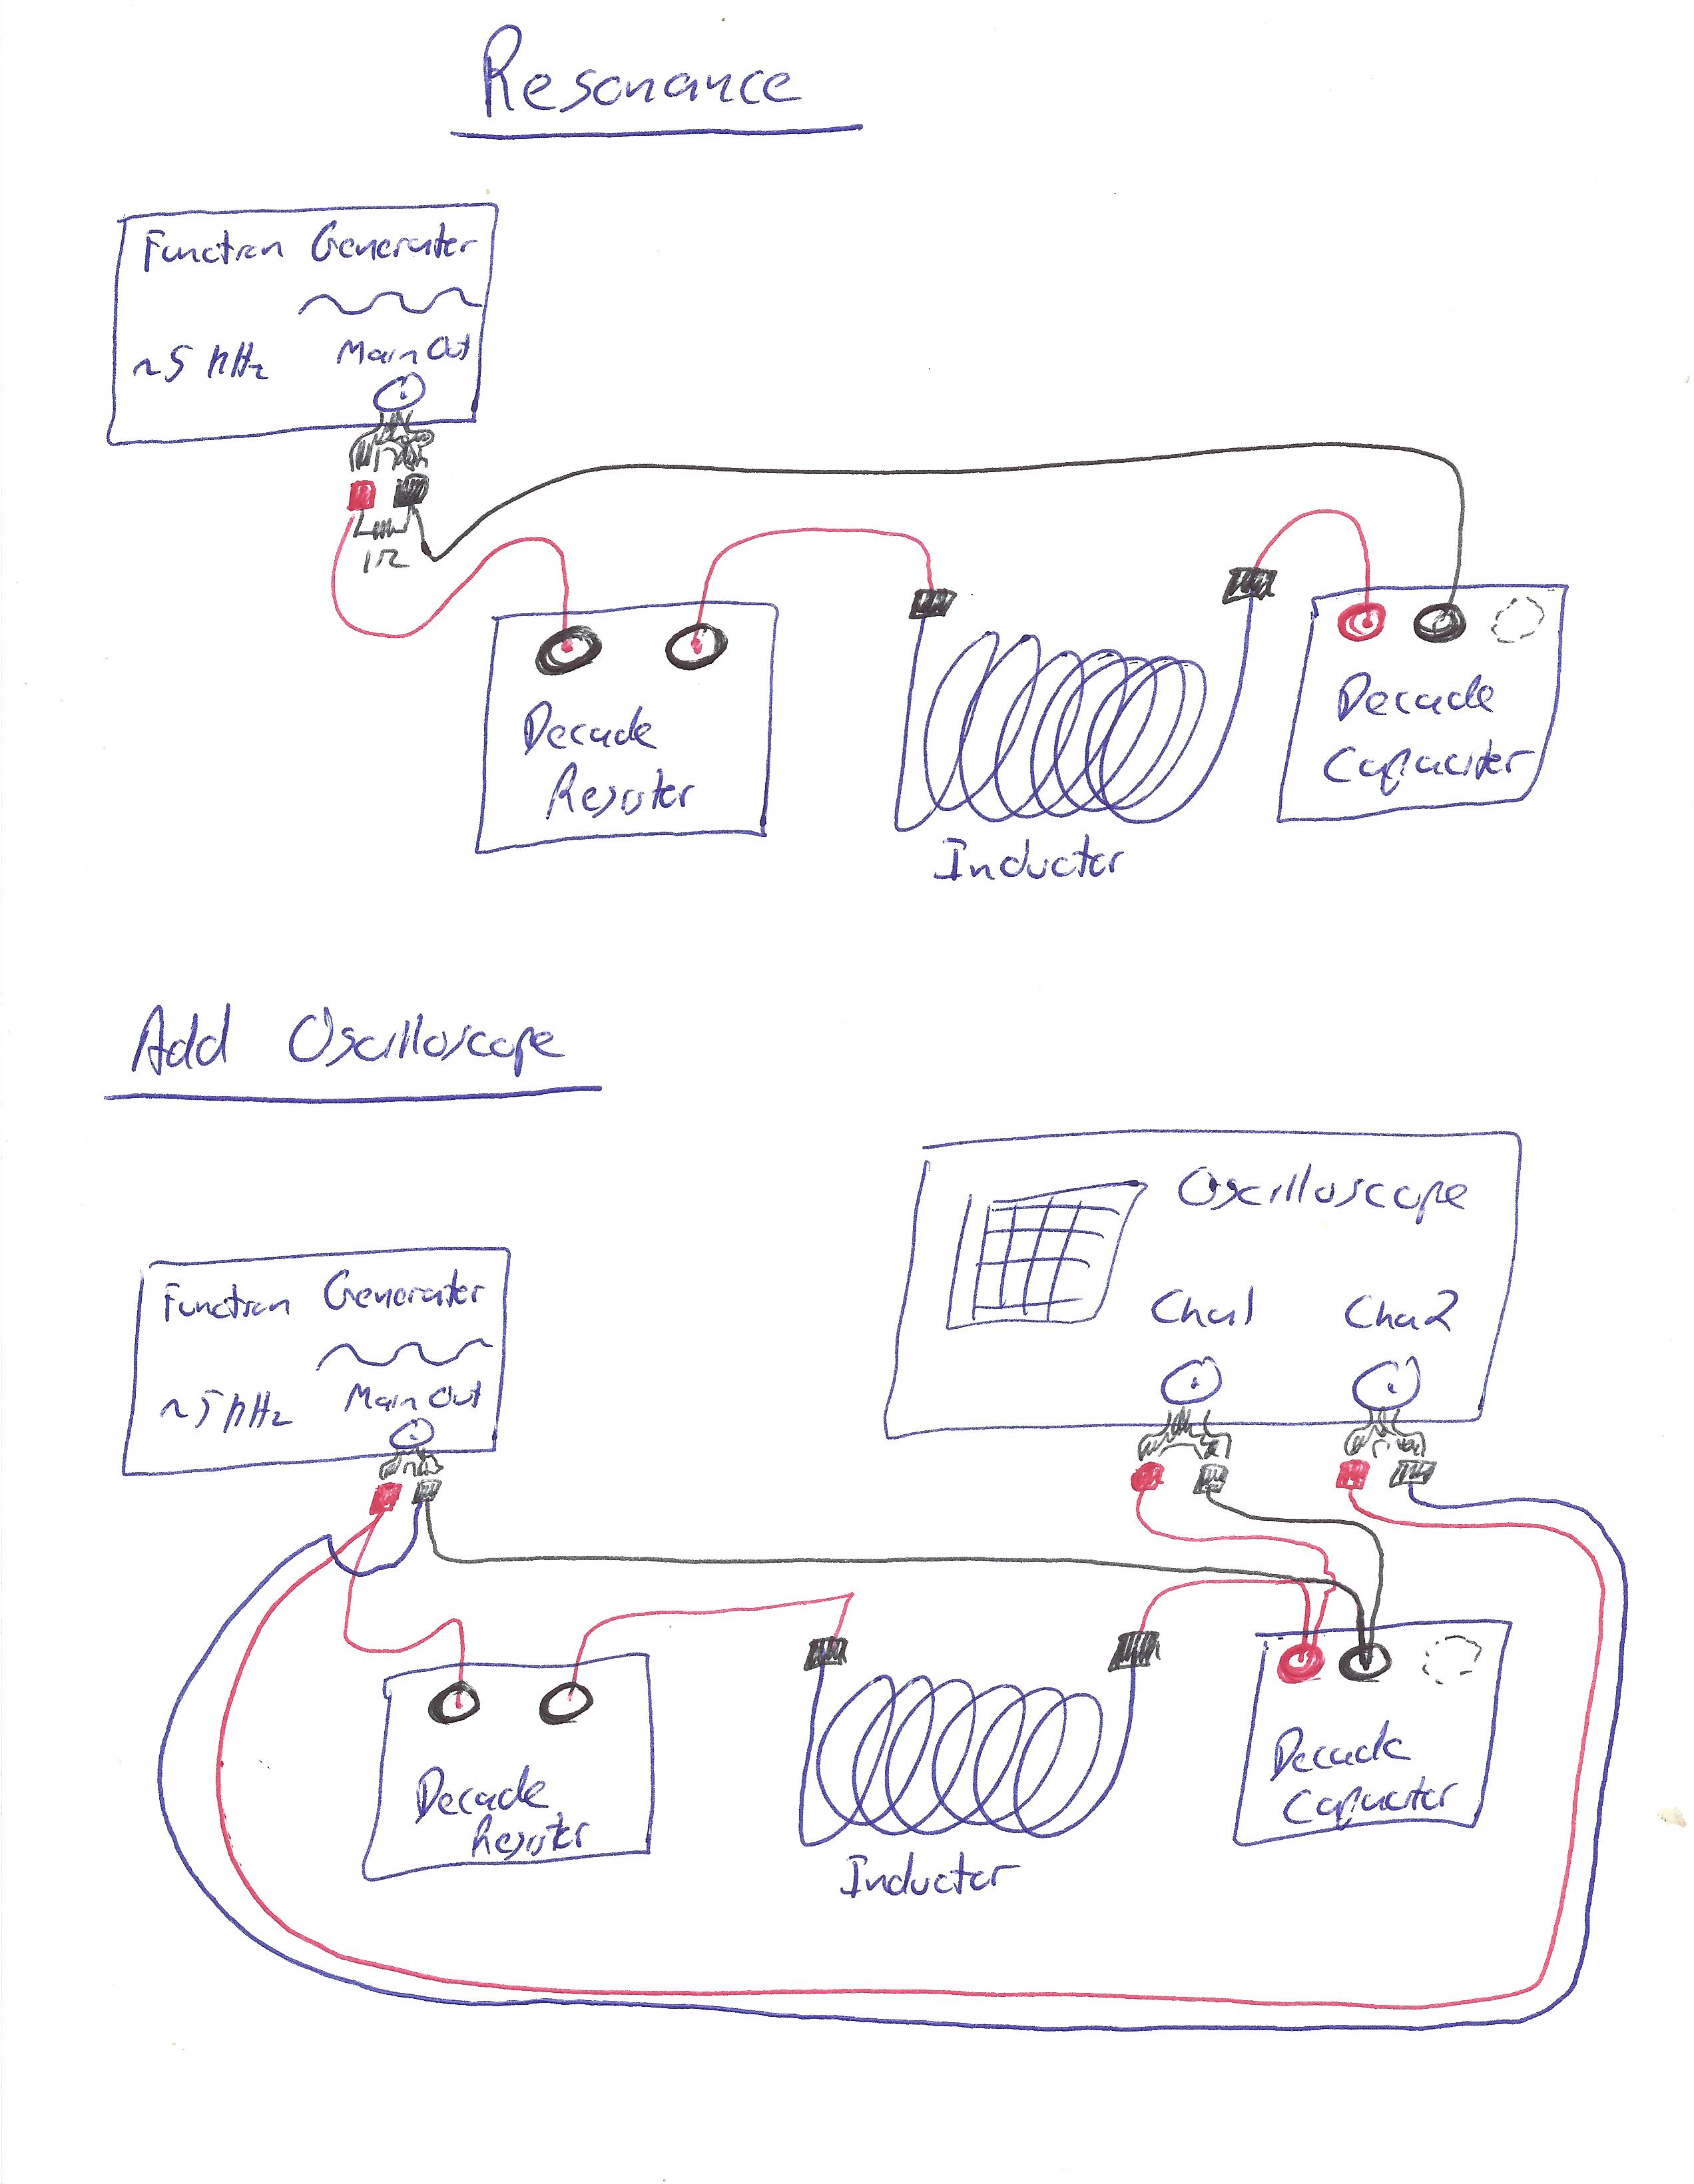
Now swap inductor and capacitor (so we now measure across the inductor). Again: amplitude and waveform.
Finally, look across the inductor and capacitor combined (so put your resistor first, then your capacitor and inductor, and wire the oscilloscope across the inductor and capacitor combination). Again, measure amplitude and determine waveform.
Part I: Plotting the Resonance Peak
For each measurement in Part I:
- Calculate your expected damping \(\gamma\) and resonant frequency \(\omega_0\). Propagate uncertainties.
- Convert all your frequencies \(f\) into angular frequencies \(\omega\), and propagate uncertainties. Do the same with your estimated resonance frequency.
For Measurements 1 and 3 in Part I:
- Using our specialized Resonance Plotting Tool, plot out the voltage across the resistor, \(V(\omega)\) versus \(\omega\).
- That tool will give you the three parameters we use to fit the curve: \(V_0\), \(\gamma\), and \(\omega_0\) (along with corresponding uncertainties). Record these.
- Answer the questions on your data sheet about whether your results agree to within uncertainty.
Then, compare your three resonance curve plots (in particular: measurement 1 to measurement 2, where we changed \(\omega_0\) but not \(\gamma\), and measurement 1 to measurement 3, where we changed \(\gamma\) but not \(\omega_0\)). Say a few words about how each parameter "appears" on your plot. (I.e.: when we vary \(\omega_0\), what changes on the plot? What about when we vary \(\gamma\)?)
Part II: Observing the Phase Shifts
In words, explain your results for Part II:
- Explain why the waveforms for each of the component are what they are. Advice:
- Start with formula \eqref{phase} for \(\phi\) above, and consider it at the resonant frequency. (Or, equivalently, consider the phasor diagram at resonance; the phase shift \(\phi\) is the same as the phase of the signal in that diagram.)
- Recall: we considered are input to have a sinusoidal waveform. This matches the description given above, in \eqref{resinput}.
- Consider the phase you computed in the context of \eqref{ressoln}. Remember that the voltage across the capacitor is proportional to \(Q(t)\). Why does the voltage across the capacitor look like it does?
- How do the other circuit components' voltages should relate to \(Q(t)\) [or its derivatives - hint, hint]? What does this mean about their waveforms?
- What do you expect the voltage across the resistor to be? Is it close?
- What do you expect the voltage across the inductor+capacitor combination to be? Is it close?
- How can the voltage amplitude across the capacitor and inductor (individually) be larger than the input voltage? Wouldn't this contradict Kirchoff's laws, which says that the voltages have to add up to the input voltage? [Can this happen for a DC circuit with a single power supply? If so, how? If not, what's different?]
Your TA will ask you to discuss some of the following topics (they will tell you which ones):
- Q-Factor: Rather than using \(\gamma\), a common characterization of resonance curve is their \(Q\) factor, \(Q=\frac{\omega_0}{\gamma}\). What would this represent about the resonance curve? What is this for each of your resonance curves? Compute your \(Q\) for each of your resonance curves (using your theoretical values).8
- Systemic Error - Resistance of the Inductor: The inductor has a small but potentially-relevant resistance (which we believe to be about 2Ω).
- Qualitative Impacts (Part I): Which of the parameters (\(V_0\), \(\gamma\), and \(\omega_0\)) would we expect to be "thrown off" by this additional resistance, compared to what we expect? How/why? For which of your three resonant peaks do you expect the impact to be the largest, if any (and why)?
- Qualitative Impacts (Part II): Which of the measurements in Part II do you expect to be "thrown off" by this systemic error (if any), and why/how?
- Estimating Resistance Through Quantitative Impacts: Using one of the parameters in one of your parts which does change due to this resistance and an appropriate set of measurements, compute the actual additional resistance in your circuit.
- Energy in Resonant Circuits: Consider how the energy flows around different components of a circuit at resonance.
- General Role of Circuit Components: In general, where is energy input into the circuit? Where is energy taken out of the circuit? Where is energy stored in the circuit?
- Analyzing Power through Components: To see how the energy flows between different components, we should understand what the power is through various components at different times. Consider a resonant circuit with (for simplicity) \(L=R=C=V_0=1\) (in SI units), and sketch the following plots:
- A voltage vs. time plot for each of the function generator, inductor, resistor, and capacitor.
- A power vs. time plot [recall that power is \(P=IV\)] for each of the function generator, inductor, resistor, and capacitor.
- Validating Solution: Plug formula \eqref{ressoln} into \eqref{ForcedOscillator} with \(F(t)\) given by \eqref{resinput}, and show that the math checks out - i.e., that you get the same thing on both sides, when you simplify. (Hint: use sum/difference identities to write \(\cos(\omega t-\phi)\) and \(\sin(\omega t-\phi)\) in terms of \(\cos(\omega t)\), \(\sin(\omega t)\), \(\cos(\phi)\), and \(\sin(\phi)\). You'll also need to do some nontrivial trig algebra to simplify expressions like \(\cos(\arctan(\ldots))\).3)
- Inability to Determine Circuit Components' Parameters from Resonance Curve: Show that if you were to increase \(R\) and \(L\) by a factor of some (arbitrary) constant \(\alpha\), and decrease \(C\) by a factor of \(\alpha\), you would get a \(B(\omega)\) that simply scales by a factor of \(\alpha\), and the same \(A(\omega)\). Explain why this shows we cannot measure our circuit components from the resistor's voltage alone, and make an argument that we also could not directly measure any circuit components' strengths from a fit to the capacitor's or inductor's voltage curves.9
- Inverse Capacitance: Note how \(1/C\) appears in this equation in the same way that \(R\) and \(L\) do. Explain how this leads naturally to the "weird" combination laws for addition of capacitors: resistors in series add, inductors in series add, but capacitors add inverses (and similarly for in parallel). What is different about how we define capacitance (compared to resistance and inductance) that leads to these unusual rules?
Hovering over these bubbles will make a footnote pop up. Gray footnotes are citations and links to outside references.
Blue footnotes are discussions of general physics material that would break up the flow of explanation to include directly. These can be important subtleties, advanced material, historical asides, hints for questions, etc.
Yellow footnotes are details about experimental procedure or analysis. These can be reminders about how to use equipment, explanations of how to get good results, troubleshooting tips, or clarifications on details of frequent confusion.
Resonance in mechanical systems is discussed in Katz Chap. 16-10 and Giancoli Chap. 14-8
For a review of electrical resonance from your textbook, see Katz Chap. 33-9 or Giancoli Chap. 30-9
If you're sketchy on how to calculate those things, Wikipedia has a nice table here, although if you're clever with your triangles it'll make your work a little easier.
In fact, any periodic signal can be represented as a (perhaps infinite) sum of sine waves of different frequencies. Since a linear differential equation like this "splits nicely" over the sum, in the sense that a sum terms on the right hand side yields a sum of the individual solutions (up to initial conditions), we can analyze each frequency independently, and them combine them back together for a "full" solution. Hence, this type of signal is more general than it appears.
This is an unusual way to express the solution for the case of mechanical resonance, when we are interested in \(Q(t)\), which would be the position. However, in electrical resonance, we're interested in \(Q'(t)=I(t)\) as our basic measurement, and this representation gives a convenient form for \(Q'(t)\).
In electrical resonance, we're more interested in the current \(Q'(t)\) anyway. You can, of course, find the exact maximum amplitude for \(Q(t)\) itself by taking a derivative of \(B\) with respect to \(\omega\). However, often, \(\omega=\omega_0\) is a good enough approximation even in this case.
Although in this lab, we focus on electrical resonance, the same phenomenon occurs in a mechanical system, known as mechanical resonance. You should be able to see that a spring-mass system (with an appropriate damping factor \(\gamma\) for a "friction-like" force that increases proportionately to speed) which is being pushed could be modeled in such a way (where \(F(t)\) is some sort of external pushing force, and here we're working for \(m=1\)).
There are two conventions for defining reactance of a capacitor. One is to have \(X_C\) be positive, the other is to have \(X_C\) be negative. Here, we choose the first convention, but be aware that both are used.
This is consistent with the definition of \(\phi\) used in phasor diagrams, even if the choice of "basis" is a little different.
Usually, in a phasor diagram, the signal is considered "ahead" of the output, rather than the output "behind" the signal; i.e., the signal is \(\sin(\omega t+\phi)\) and the output is \(\sin(\omega t)\), rather than \(\sin(\omega t)\) and \(\sin(\omega t-\phi)\), respectively. However, clearly, these are equivalent, up to a shift in time, so those two pictures are really the same.
The phasor picture clarifies some analysis, because it means every component contributes consistently (resistances are always \(x\) and reactances are always \(\pm y\)). On the other hand, this perspective holds the "signal phase" fixed at zero, which in many ways makes more intuitive sense.
Since they're equivalent, it doesn't matter which way you understand things for the purposes of this lab.
This puts a 1Ω resistor in parallel with "everything else," from the perspective of our function generator. Since 1Ω is small, and impedances in parallel add in reciprocal, this ensures that the 1Ω resistance is the impedance the function generator sees consistently (regardless of frequency). This prevents any change in the amplitude our function generator outputs: in general, due to practical constraints, the amplitude might depend on the "load" you put on it, but here, the "load" looks constant to the function generator. If we're supposed to be plotting out the response to a constant input, making sure our input doesn't vary is important - we don't want to combine two different effects!
Another characterization of \(Q\) is that it's the ratio of energy stored to energy lost per cycle (times \(2\pi\)), so it characterizes how effective our system is at "keeping" energy. [Hence, typically, in most systems, one wants a very high \(Q\) factor - although this isn't universally the case.]
In a sense, this is a variant of a dimensional analysis argument.
Remember to ensure that the resistor is the last component in your circuit to avoid grounding your circuit in two different places (as both the oscilloscope and function generator are wired to the same external ground, thus implicitly to each other).
The center-to-peak voltage corresponds to the amplitude one would use when describing the wave with a trigonometric function. Often measuring "peak-to-peak" and then cutting the value in half is easy and completely equivalent.
That is, if you find the maximum amplitude on Cha 1 occurs when the function generator is at 436 Hz, start your scan at \(436 \div 2 \approx 200\) Hz
That is, if you find the maximum amplitude on Cha 1 occurs when the function generator is at 436 Hz, start your scan at \(436 \div 2 \approx 200\)Hz, end at \(436 \times 1.5 \approx 700\)Hz in steps of \( \sim 50\) Hz
This may mean that your different measurements have different voltage uncertainties, as smaller oscillations can be expanded on your screen and therefore more closely measured!