
Inductors
In this lab, we will measure the inductance of an inductor in three different ways: first, from first principles, using the geometry of the inductor; second, using an LR circuit; third, using an LC circuit.Hoveroverthese!
- 1 Oscilloscope
- 1 Function Generator
- 1 Solenoid Coil
- 1 Decade Resistor
- 1 Decade Capacitor
- Banana cables (8) and alligator clips (8)
- Record data in this (Google Sheets data table)
Inductors
An inductor is a circuit component which resists a change in current. The voltage across an inductor is:
$$V_L=-LI'(t)$$A typical inductor arrangement is a solenoid of wire with some magnetic material instide. If the solenoid has \(N\) loops, with a cross-sectional area \(A\) and a length \(l\), and the material inside has a permeability \(\mu\), the inductance \(L\) of this coil is:
$$L=\frac{\mu N^2A}{l}$$In this lab, our inductors will be empty, so \(\mu=\mu_0\).1
LR Circuits
If we have connect an inductor and resistor in series to a DC input of magnitude \(V_0\) (known as an LR circuit),2 Kirchoff's voltage law gives us a differential equation obeyed by the current (note \(I'(t)=\frac{dI}{dt}\) denotes the derivative of \(I(t)\)):
$$LI'(t)+RI(t)=V_0\label{LReq}$$The general solution for \(I(t)\) is given by an exponential decay:
$$I(t)=\left(I(0)-\frac{V_0}{R}\right)e^{-t/\tau}+\frac{V_0}{R}\label{LRsol}$$Here, \(I(0)\) is the initial current, which is dependent on how we "start" our system. If we take the usual situation of turning on the DC input (such that before \(t=0\) we had no voltage and no current), then \(I(0)=0\). The time constant \(\tau\) is calculated as:
$$\tau=\frac{L}{R}$$Note that, just as I(t) approaches a steady steady current, \(I'(t)\) will decay to its equilibrium value with the same time constant (as you can see by taking a derivative of \(I(t)\)). Similarly, since the voltages across the resistor and inductor are proportional to \(I(t)\) and \(I'(t)\) respectively, these also decay to their equilibrium values.
In this lab, we will be working with a square wave (oscillating with amplitude \(V_0\)), not a DC power supply and a switch. This is almost an equivalent situation, with some small technicalities that aren't important here.
To be precise: if the period of this square wave is much larger than \(\tau\), such that whenever the sign of the input flips we are approximately in equilibrium (with \(I=\pm V_0/R\)). In this case, we can treat each segment of the square wave as an "independent" DC input (just with a slightly modified initial condition).
Now: the measurements we are actually going to be making in this lab are the difference between the voltage and the equilibrium voltage for one exponential curve (and the corresponding times). These voltages \(V(t)\) should therefore obey the simpler-to-write relationship:
$$V(t)=V_0e^{-t/\tau}$$Here, \(V_0\) is some constant "initial voltage difference" that we don't care about and \(\tau\) is the same time constant as above. To make our plot, we're going to work with the log of this equation, expressible in the suggestive form:
$$\ln(V)=\left(-\frac{1}{\tau}\right)t+\ln(V_0)$$Note the linear relationship (albeit with an intercept!) between \(\ln(V)\) and \(t\); this is the relationship we will be plotting in this lab. (This technique of fitting an exponential curve is known as making a log-linear plot.
LC Circuits
Suppose now we connect an inductor and capacitor in series to a DC input of magnitude \(V_0\) (known as an LC circuit);3 then, Kirchoff's voltage law gives a slightly different equation:
$$LQ''(t)+\frac{1}{C}Q(t)=V_0\label{LCeq}$$Here, \(Q(t)\) is the charge on the capacitor; note that \(Q'(t)=I(t)\), so \(Q''(t)=I'(t)\) yields the inductor voltage.
The general solution for \(Q(t)\) for this expression is oscillatory:
$$Q(t)=CV_0+(Q(0)-CV_0)\cos(\omega_0 t)+\frac{I(0)}{\omega_0}\sin(\omega_0 t)\label{LCsol}$$The angular frequency \(\omega_0\) for this expression is given by the formula:
$$\omega_0=\frac{1}{\sqrt{LC}}$$Recall also that the angular frequency \(\omega\) for an oscillation is defined in terms of the the period \(T\) as:
$$\omega=\frac{2\pi}{T}$$Returning to the solution, note that we have two initial conditions in this case, the initial charge \(Q(0)\) and the initial charge \(I(0)\). (These are analogous to the initial position and velocity for oscillations on a spring, in some sense.)
Also, note that \(Q''(t)\) will oscillate with the same (angular) frequency \(\omega_0\) [although 180 degrees out of phase]. Hence, the voltages over the capacitor and inductor will oscillate as well.
Realistic LC Circuits
The above description is not a completely accurate account of our system. Realistically, any circuit will also have some resistance, making our circuit into an LRC circuit (rather than just an LC circuit).
In particular, since our inductor is a long segment of wire, it will have some resistance (here, approximately 2Ω), which is an additional voltage in the above equation, proportional to \(Q'(t)\) (per Ohm's law).
To leading order, a small resistance will not change the oscillatory behavior of our solution. Instead, it will simply act as an exponential "damping," slowly reducing the size of our oscillations.
Similar to the LR circuit, the square wave we use will have a long enough period that (in spite of our low resistance) the oscillations will decay "close enough" to equilibrium (zero current) that we can treat each square wave as independent (i.e., like a "flip a switch" problem rather than a driving square wave).1
A Full Description of LRC Circuits (& approximation to LC circuit explained)
Let's now deal with the resistance in our circuit with an exact solution.
Suppose we instead connect a resistor, inductor, and capacitor all in series, again with a DC input of magnitude \(V_0\), known as an LRC circuit4. Expressing our voltages in terms of the charge \(Q(t)\) on the capacitor and its derivatives, we now get the differential equation:
$$LQ''(t)+RQ'(t)+\frac{1}{C}Q(t)=V_0$$The exact solution depends on the size of the damping - there are a few cases to look at. In the case where the damping is "small enough,"25 as is the case in this lab, we can restrict ourselves to one class of solutions.
In general, we can express the solution to this differential equation in terms of the damping attenuation \(\alpha=\frac{R}{2L}\) and the resonant frequency \(\omega_0=\frac{1}{\sqrt{LC}}\) (same as in the LC circuit). With these quantities, we define the damped resonant frequency \(\omega_d=\sqrt{\omega_0^2-\alpha^2}\).3
Under these conditions, we take two arbirary constants \(A\) and \(B\) to be determined by our initial conditions \(Q(0)\) and \(I(0)=Q'(0)\), and write the general solution:
$$Q(t)=e^{-\alpha t}\left(A\cos(\omega_d t)+B\sin(\omega_d t)\right)$$For the purposes of this lab, we can make the approximation that \(\alpha\ll\omega_0\), which yields the approximation that \(\omega_d\simeq\omega_0\).4
Part I: L of a Solenoid
Measure the length and diameter of your solenoid; record these with appropriate uncertainties.1
Take the number of turns to be \(N=520\) or \(N=710\). (Don't worry, we won't make you count them.)
Part II: LR Circuits
Connect your circuit in an LR circuit according to the following diagram:23
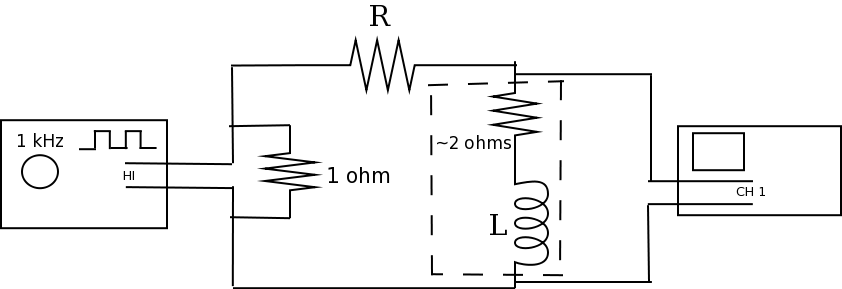
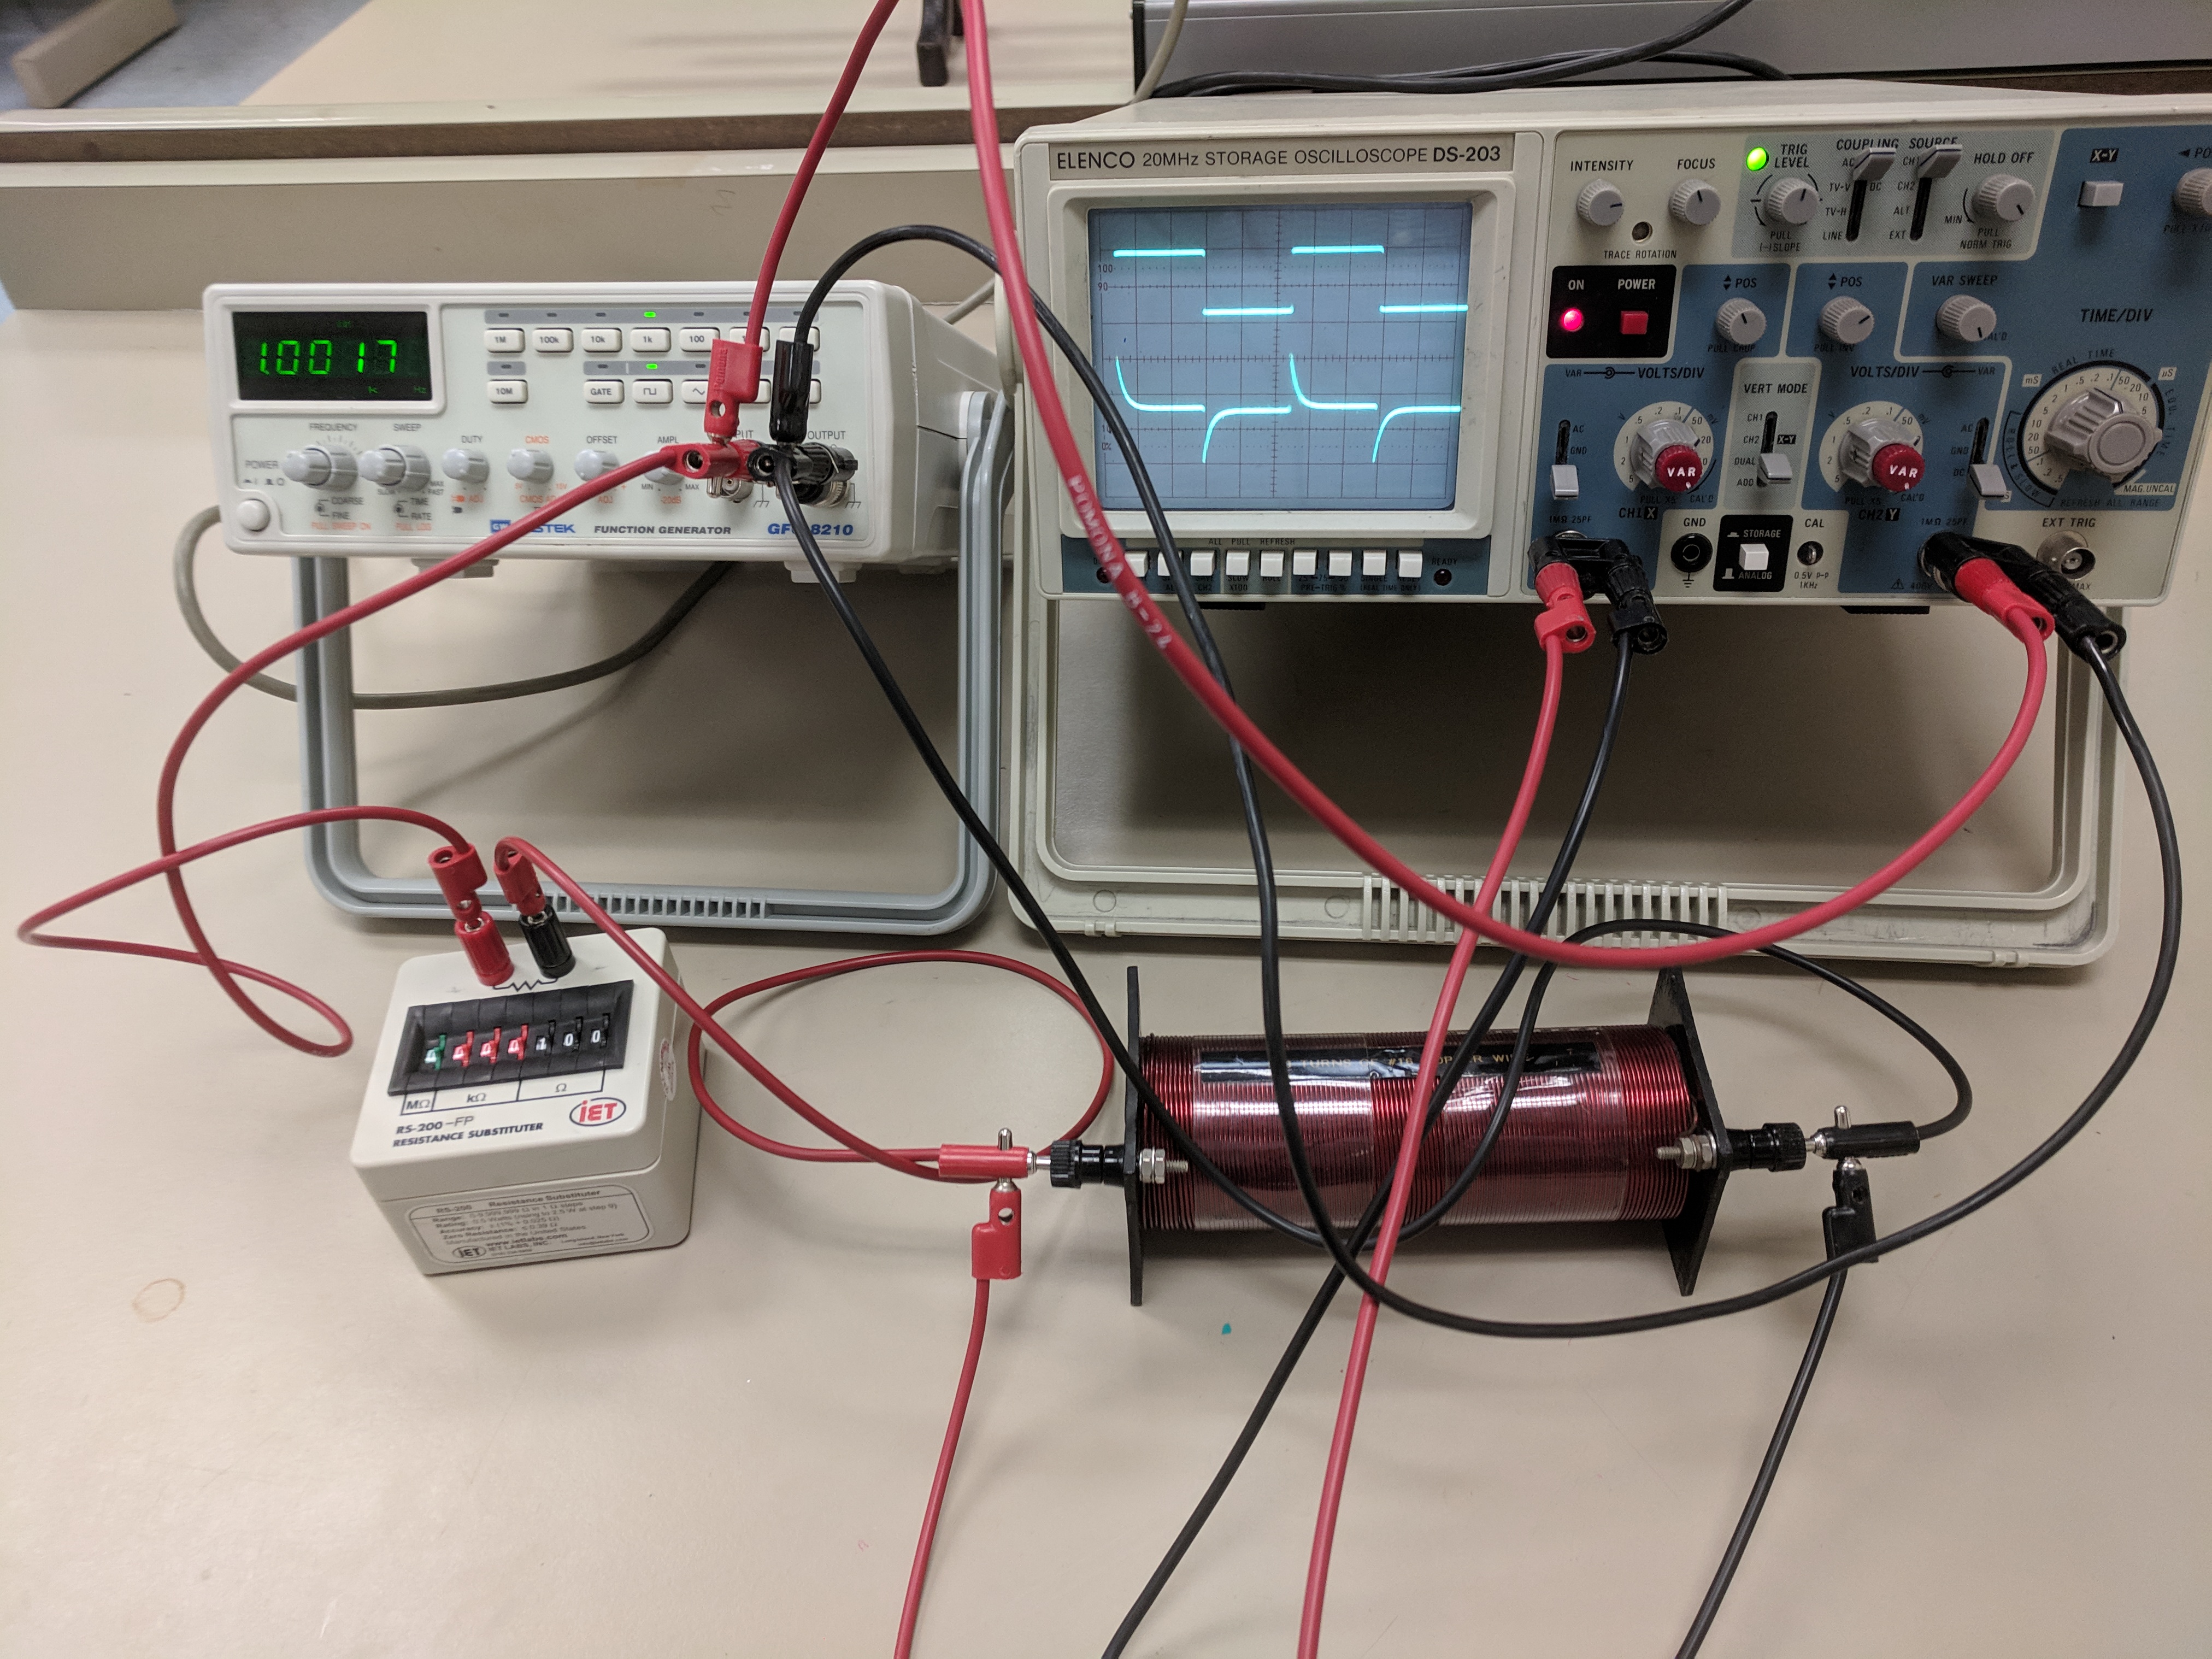
Click here for wire-by-wire instructions.
(For simplicity of using these instructions, orient the inductor so that it has one terminal on the "left side" and one on the "right side," relative to each other.)
We assume you are starting with no wires connected:
- Begin by wiring a red wire from the red terminal on the function generator to the red terminal of the decade resistor.
- Run a (red) wire from the black terminal of the resistor to the left-hand side of the inductor.
- Run a black wire from the right-hand side of the inductor back to the black terminal on the function generator.
You should now have a complete circuit.
- Connect a red wire from the red terminal on CH1 of the oscilloscope to the left-hand side of the inductor.
- Connect a red wire from the black terminal on CH1 of the oscilloscope to the right-hand side of the inductor.
CH1 of the oscilloscope should now be wired across the inductor.
- Connect a red wire from the red terminal on CH2 of the oscilloscope to the red terminal on the function generator.
- Connect a black wire from the black terminal on CH2 of the oscilloscope to the black terminal on the function generator.
CH2 of the oscilloscope should now be wired across the function generator. This completes the circuit.
Click here for wiring cartoons.
(For simplicity of using these instructions, orient the inductor so that it has one terminal on the "left side" and one on the "right side," relative to each other.)
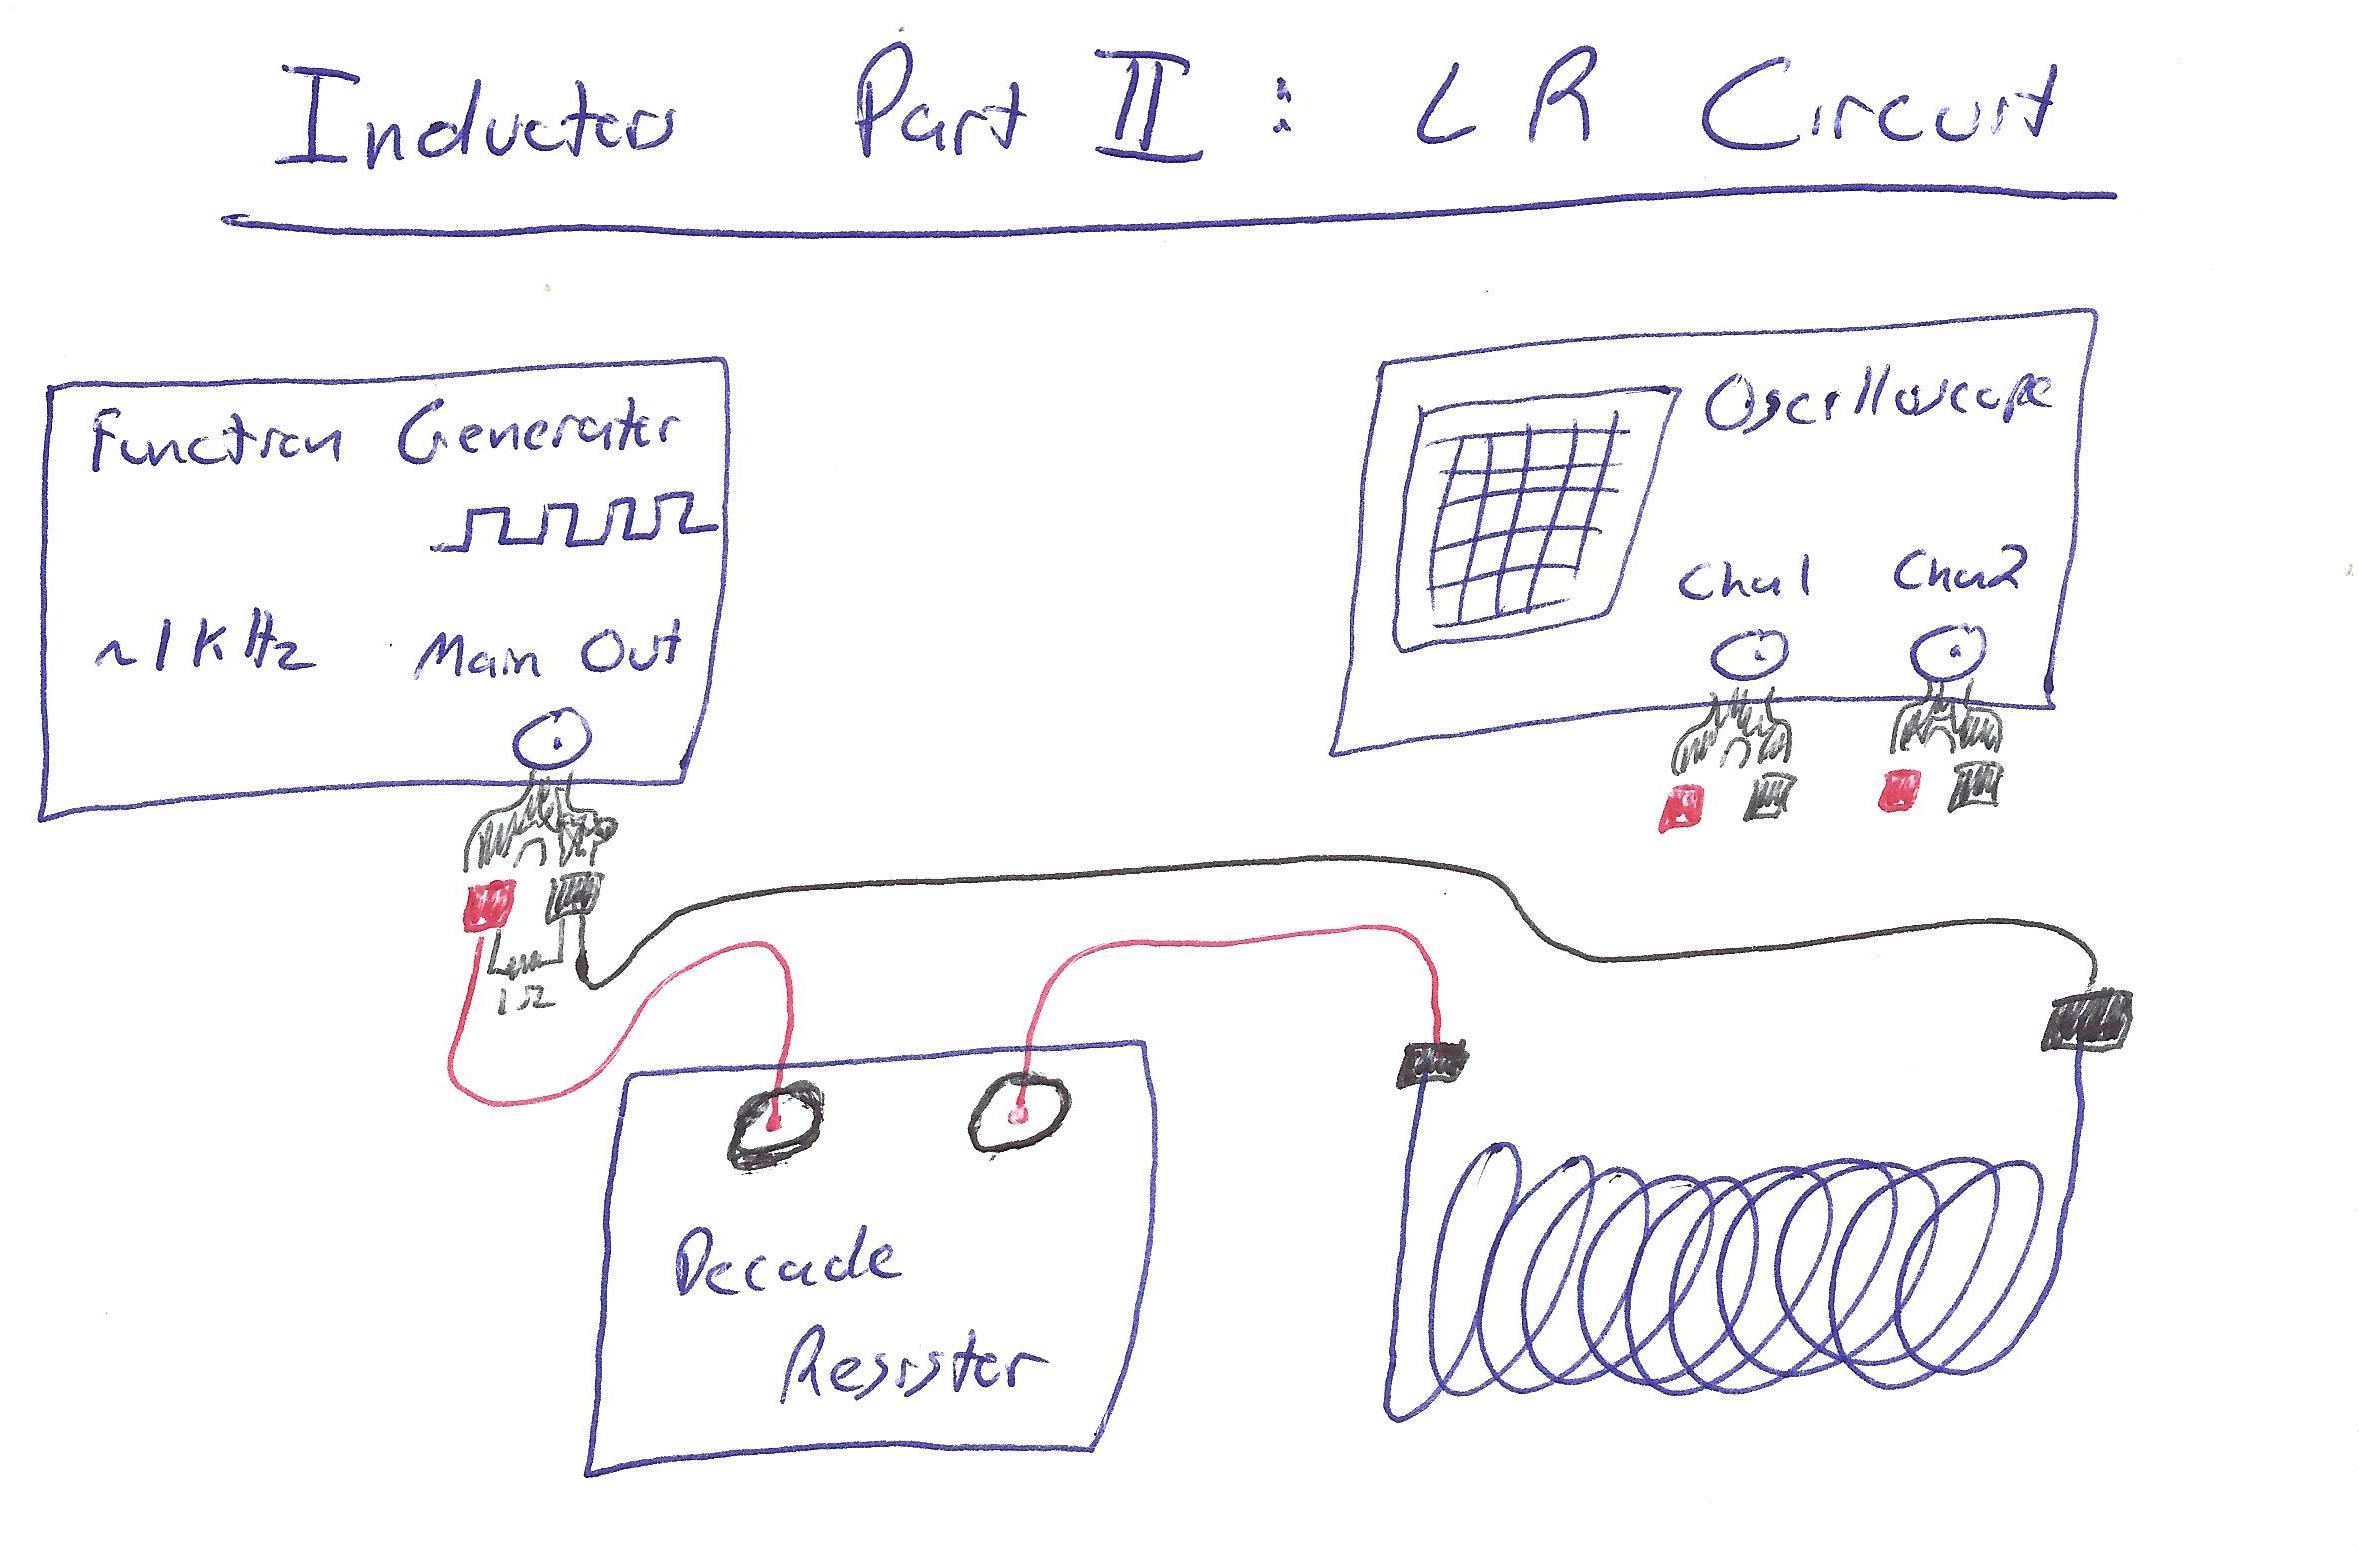
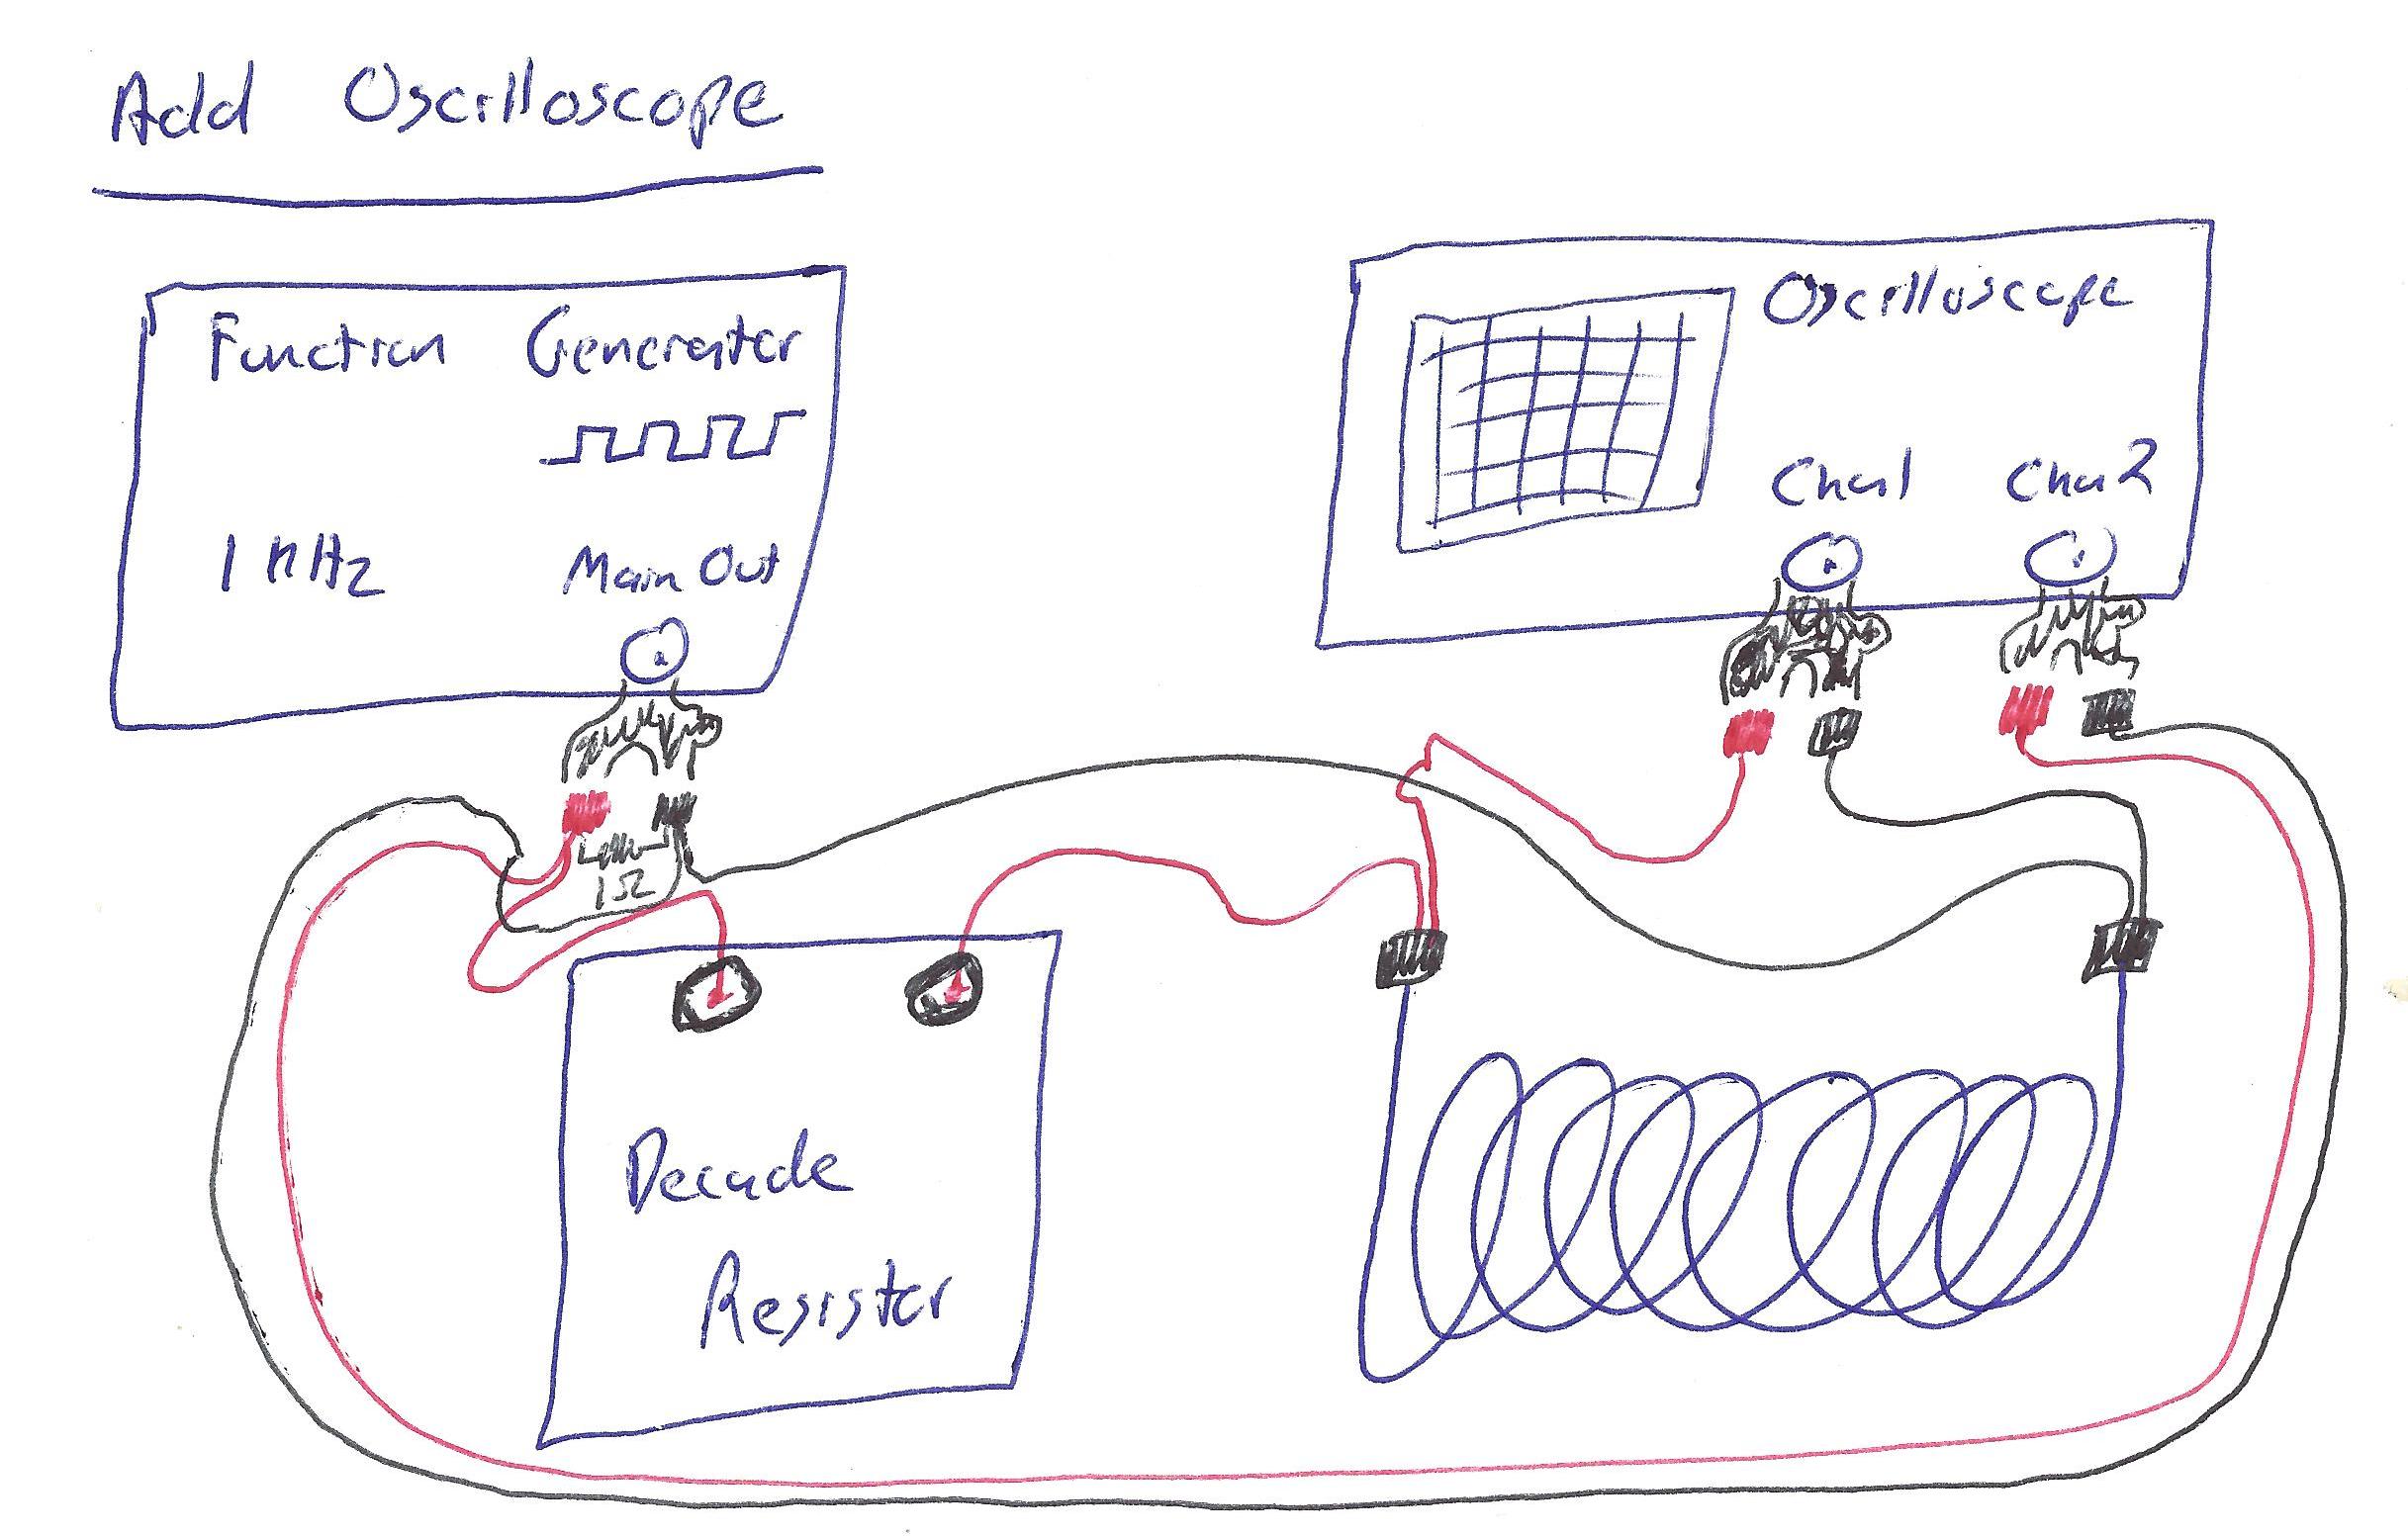
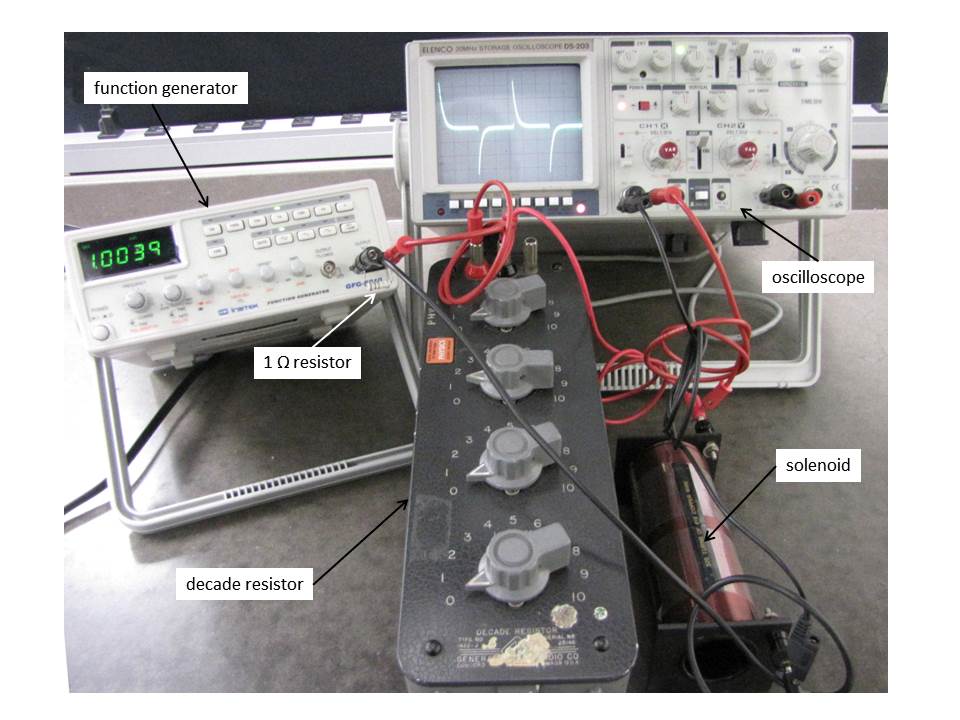
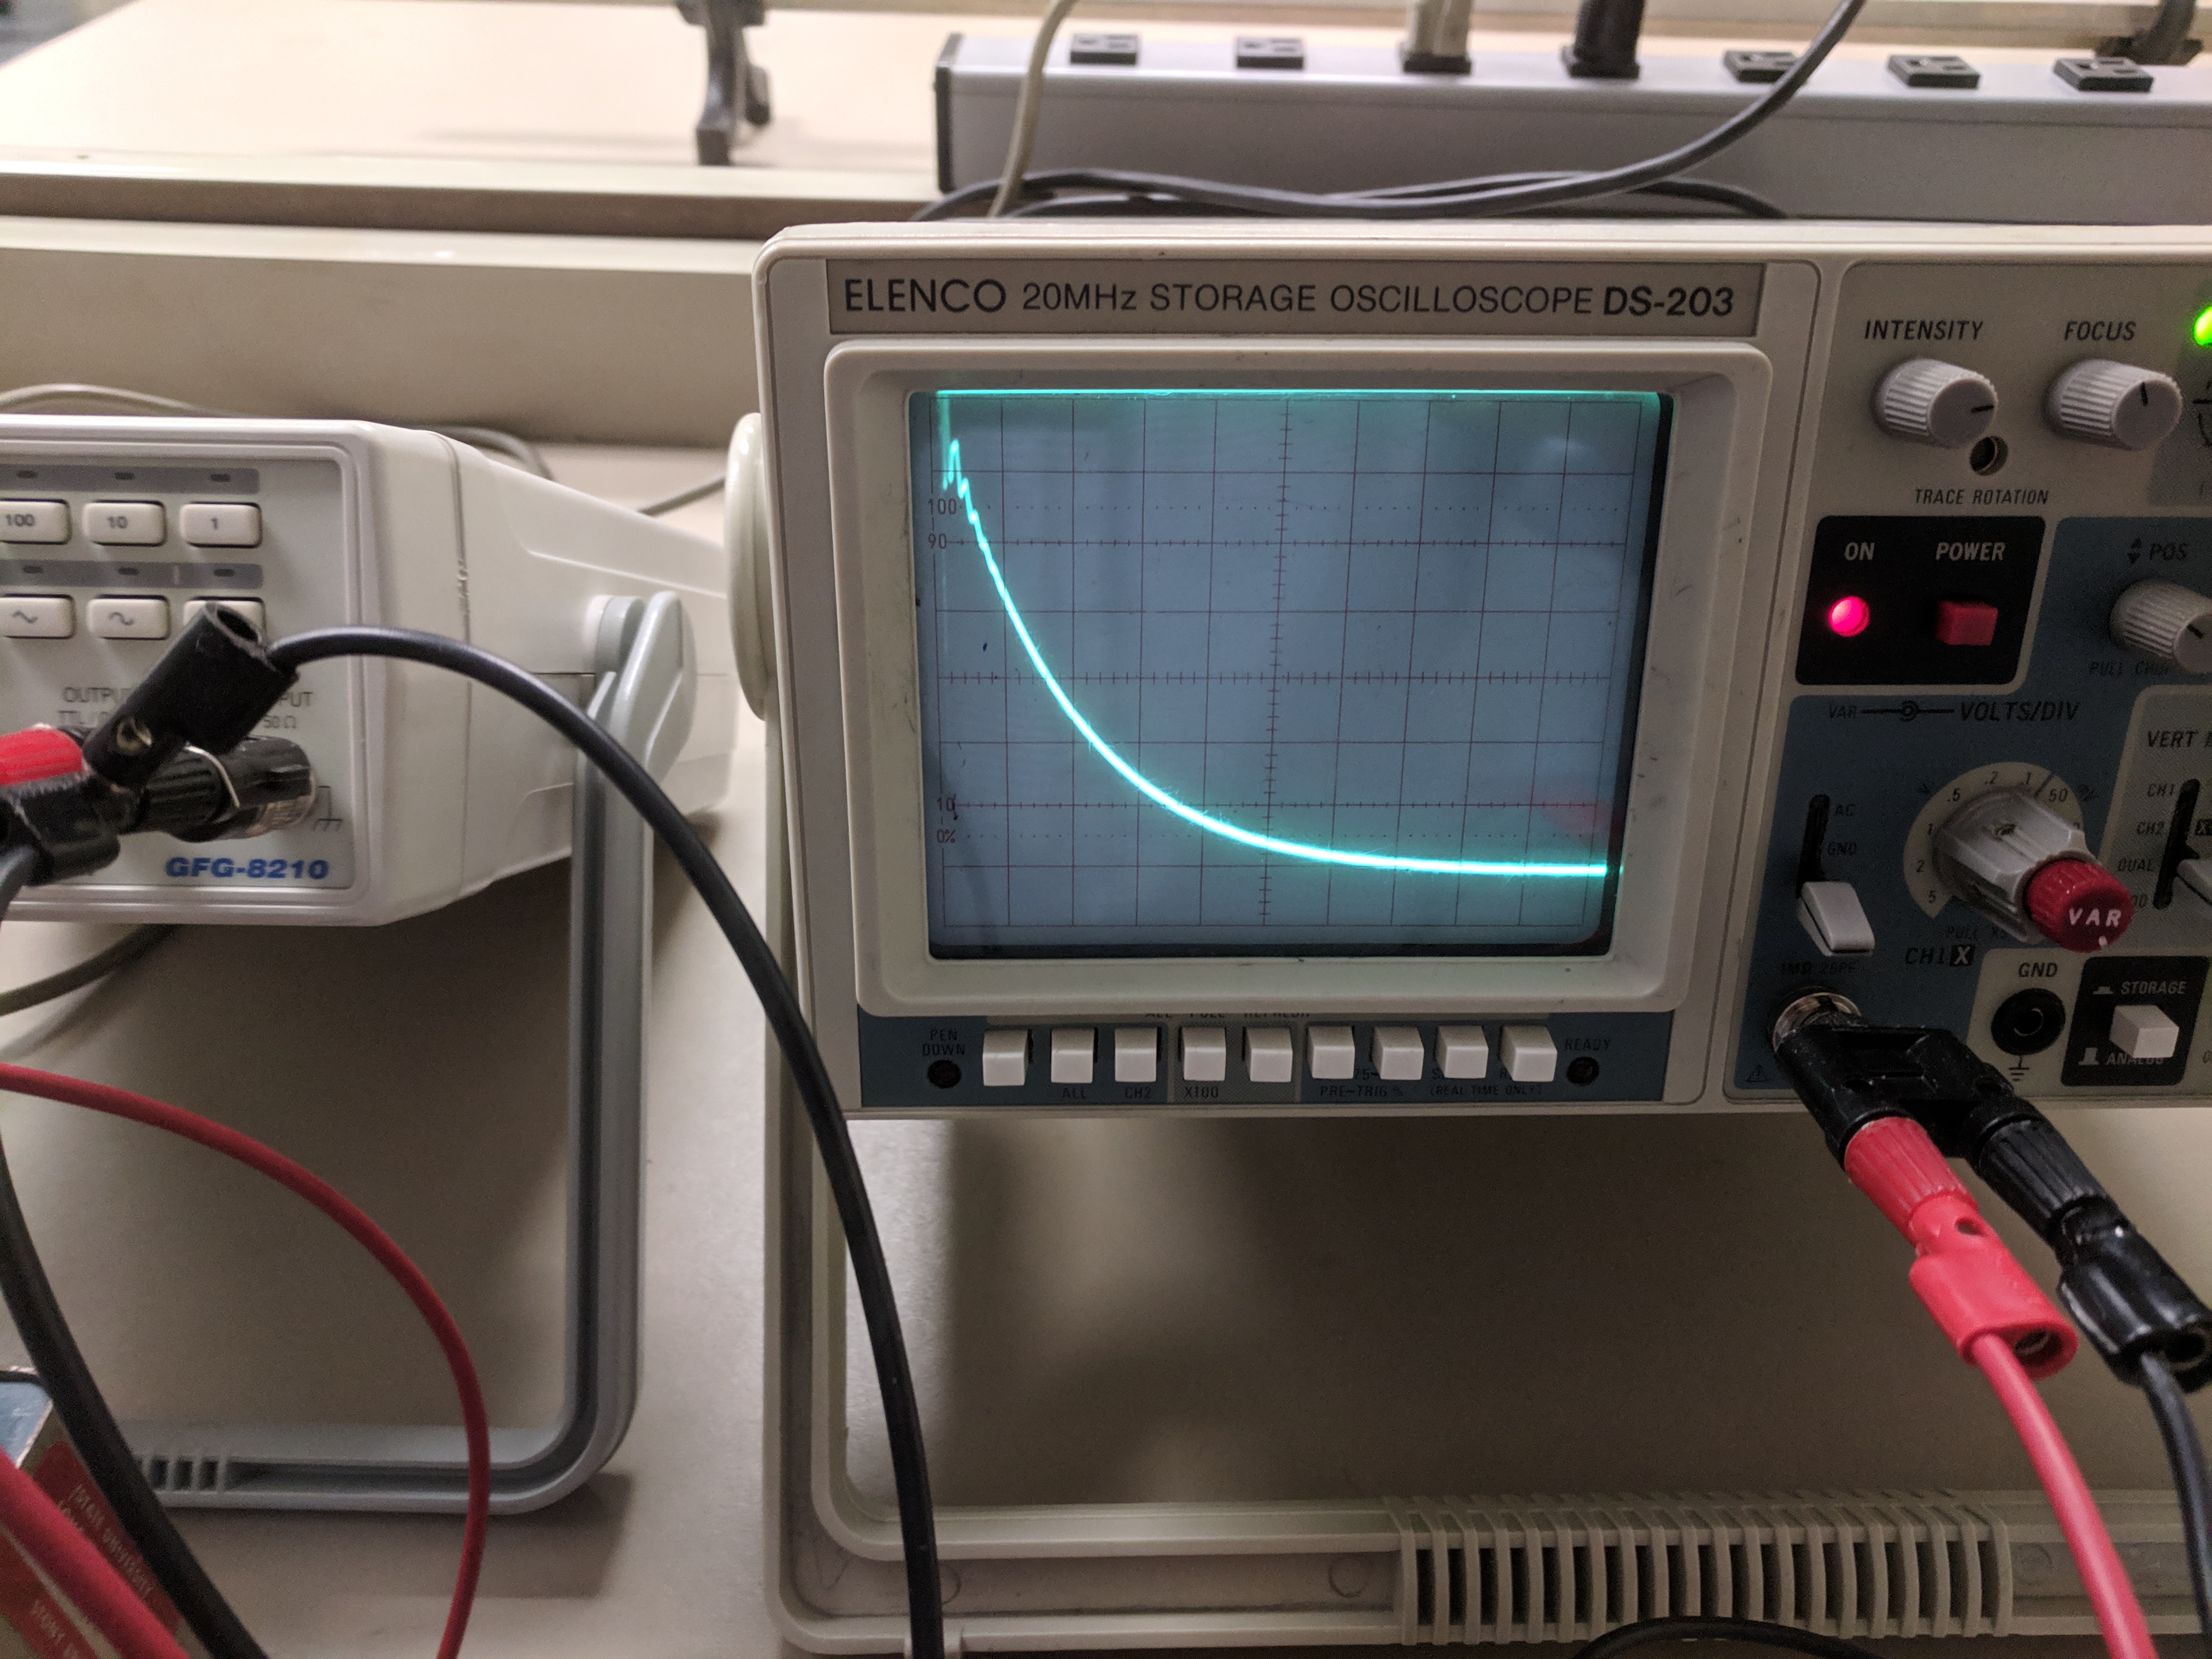
Have your function generator output a 1kHz square wave.6 Set your resistor to 100Ω.
Click here for reasonable starting oscilloscope settings.
The following knobs must be set as listed:
- POWER: Pushed in (duh)
- VAR knobs and VAR SWEEP: calibrated (most clockwise) position
- SOURCE: CH2 (we want to trigger on the square wave for a more reliable input)
- VERT MODE: DUAL (initially; you can swap to CH1 or CH2 if desired)
- COUPLING: AC
- AC GND DC (both channels): Set to DC
- XY, STORAGE/ANALOG, all buttons in bottom-left: pushed out
The following settings are a suggested starting place to get a reasonable picture, but you can more-or-less tweak these freely:
- TRIGGER LEVEL: middle position, pushed in
- INTENSITY, FOCUS: middle position
- POS knobs (both channels and time): middle position
- VOLTS/DIV: 50mV (will vary depending on amplitude setting chosen, so play with this one)
- TIME/DIV: 0.2ms
If those are set as such, your oscilloscope is plugged in, and you're still not seeing something reasonable, consult your TA.
Take one exponential decay segment, and record the voltage difference between the curve and the equilibrium voltage at five different times.
Set your resistor to 200Ω and repeat: again take five measurements of voltage difference and time.
Part III: LC Circuits
Now, wire your circuit up with the inductor and capacitor as follows (basically, replace the capacitor with the resistor):
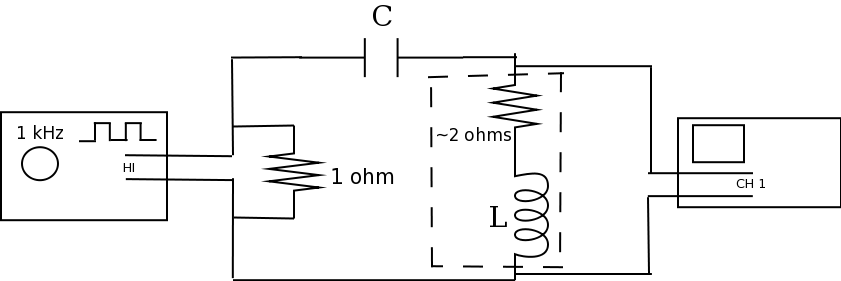
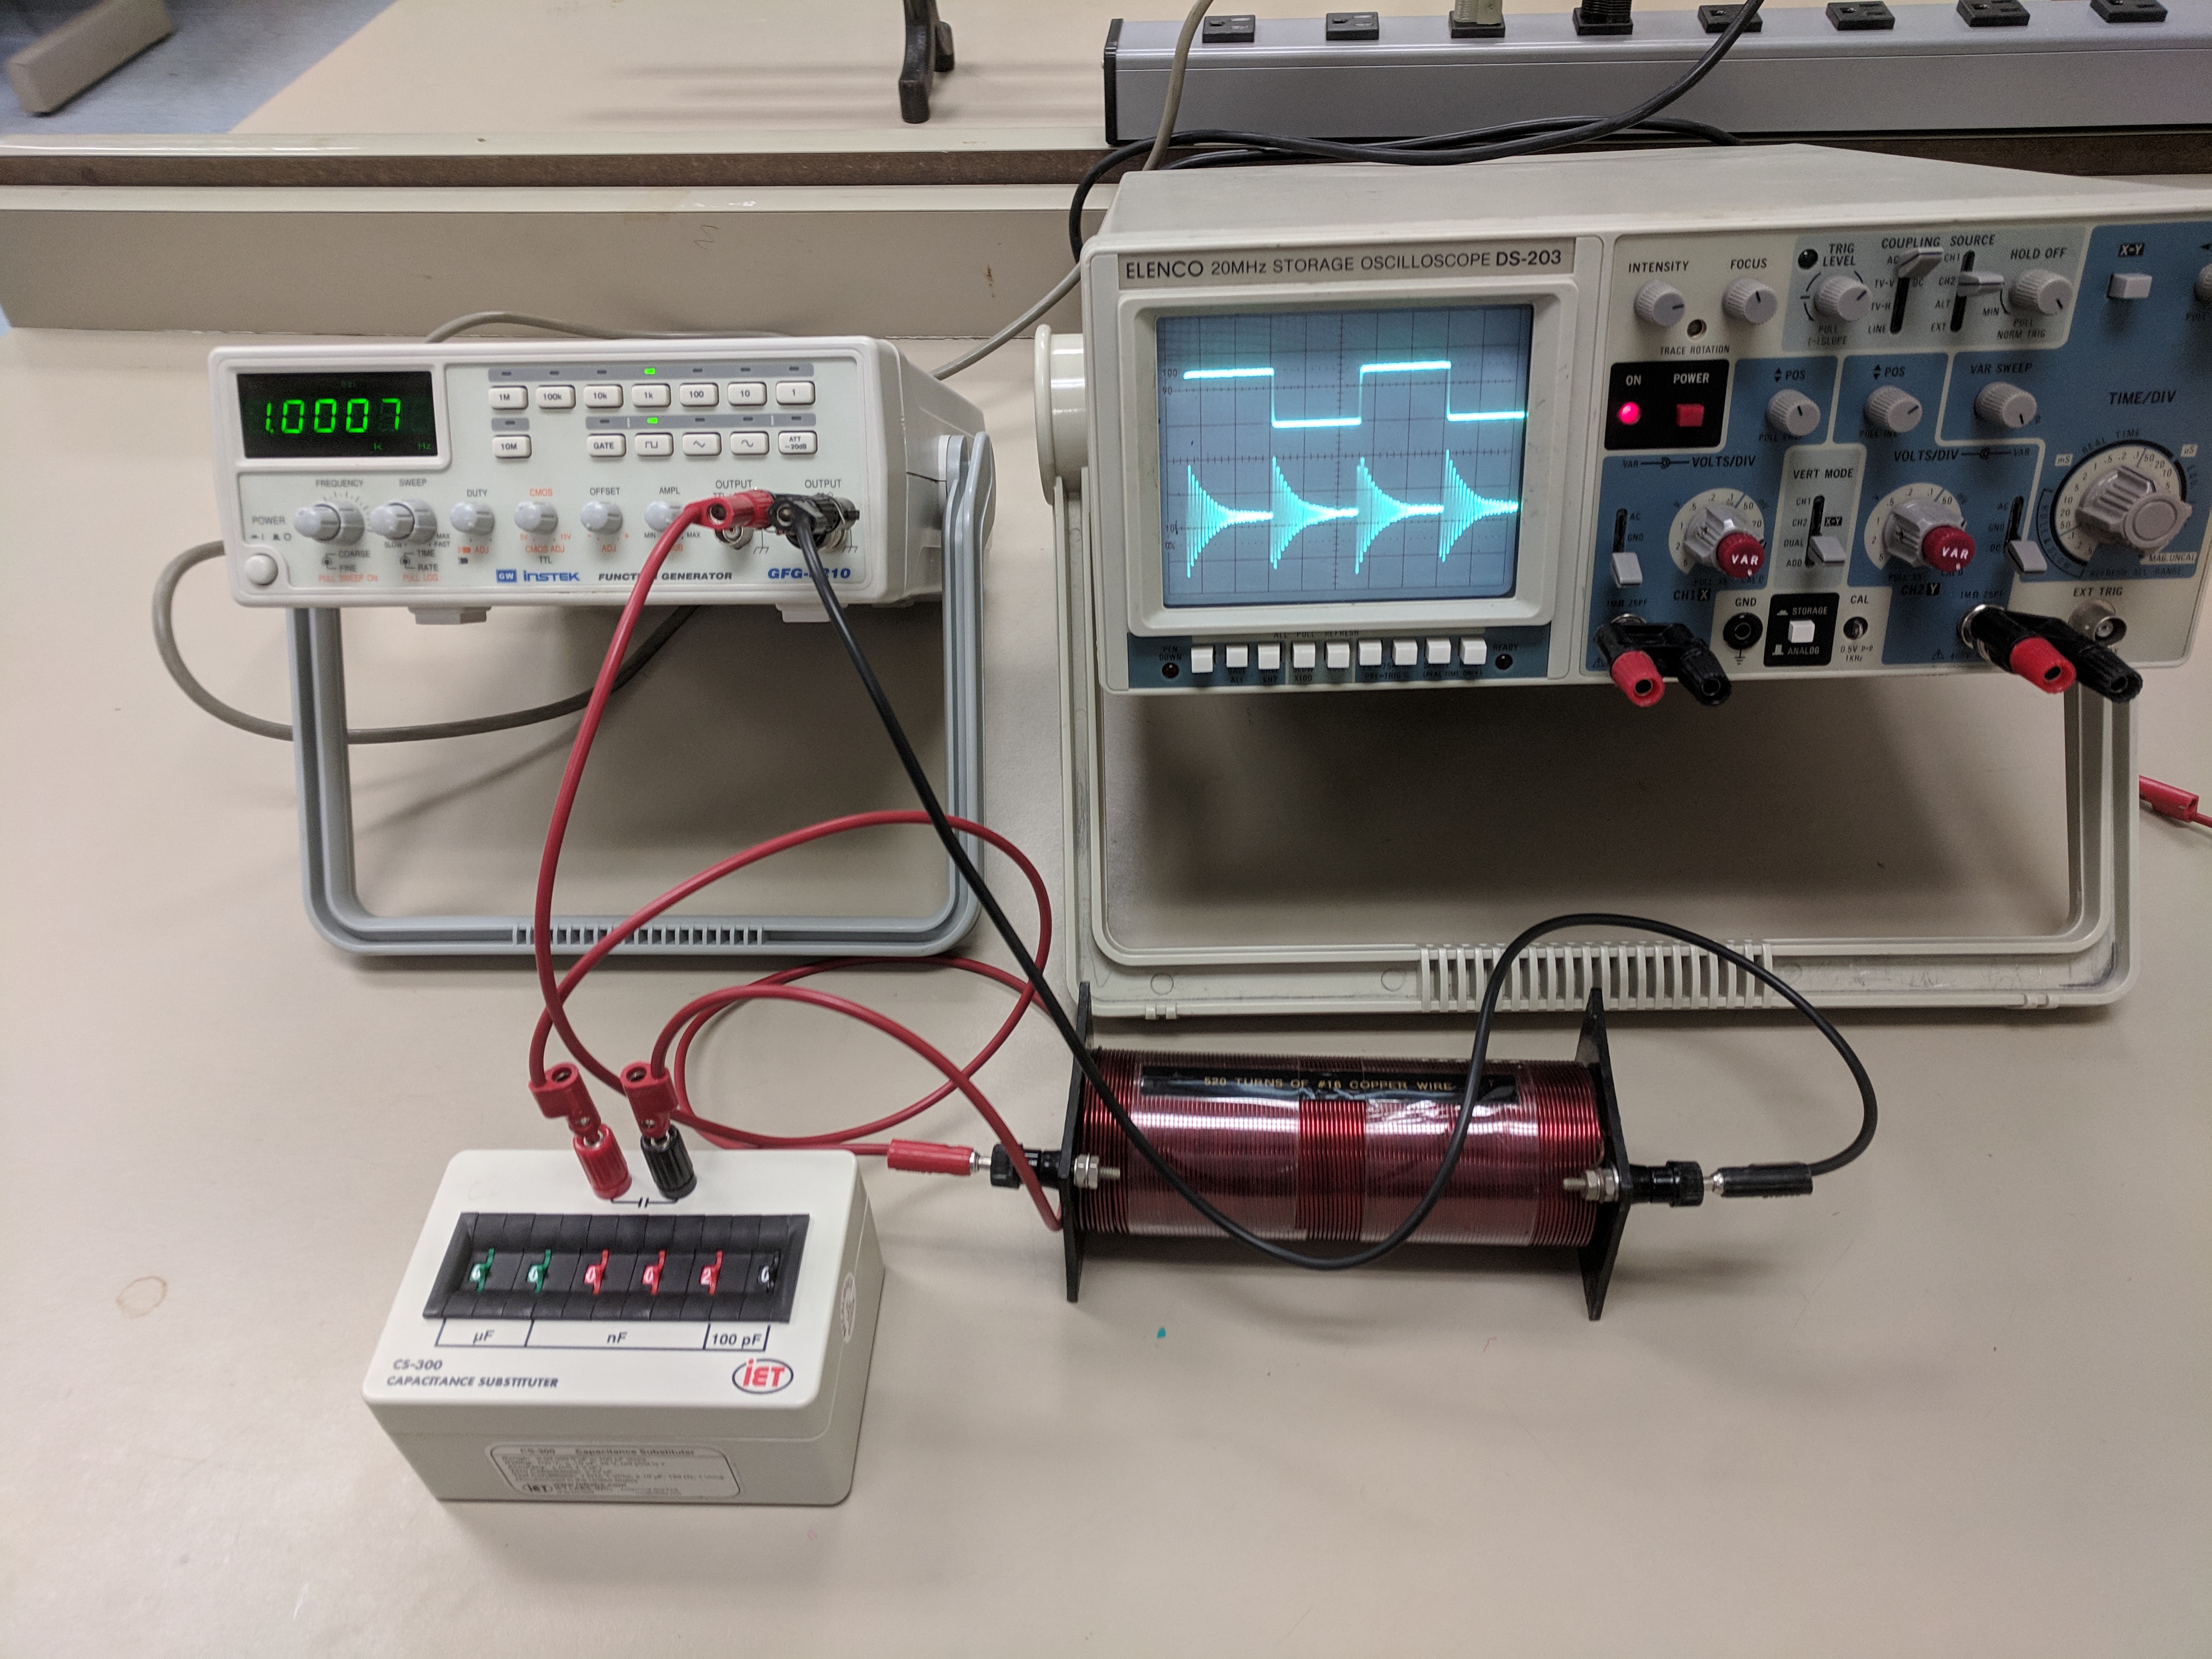
Click here for wire-by-wire instructions.
(For simplicity of using these instructions, orient the inductor so that it has one terminal on the "left side" and one on the "right side," relative to each other.)
We assume you are starting with no wires connected:
- Begin by wiring a red wire from the red terminal on the function generator to the red terminal of the decade capacitor.
- Run a (red) wire from the black terminal of the capacitor to the left-hand side of the inductor.
- Run a black wire from the right-hand side of the inductor back to the black terminal on the function generator.
You should now have a complete circuit.
- Connect a red wire from the red terminal on CH1 of the oscilloscope to the left-hand side of the inductor.
- Connect a red wire from the black terminal on CH1 of the oscilloscope to the right-hand side of the inductor.
CH1 of the oscilloscope should now be wired across the inductor.
- Connect a red wire from the red terminal on CH2 of the oscilloscope to the red terminal on the function generator.
- Connect a black wire from the black terminal on CH2 of the oscilloscope to the black terminal on the function generator.
CH2 of the oscilloscope should now be wired across the function generator. This completes the circuit.
Click here for wiring cartoons.
(For simplicity of using these instructions, orient the inductor so that it has one terminal on the "left side" and one on the "right side," relative to each other.)
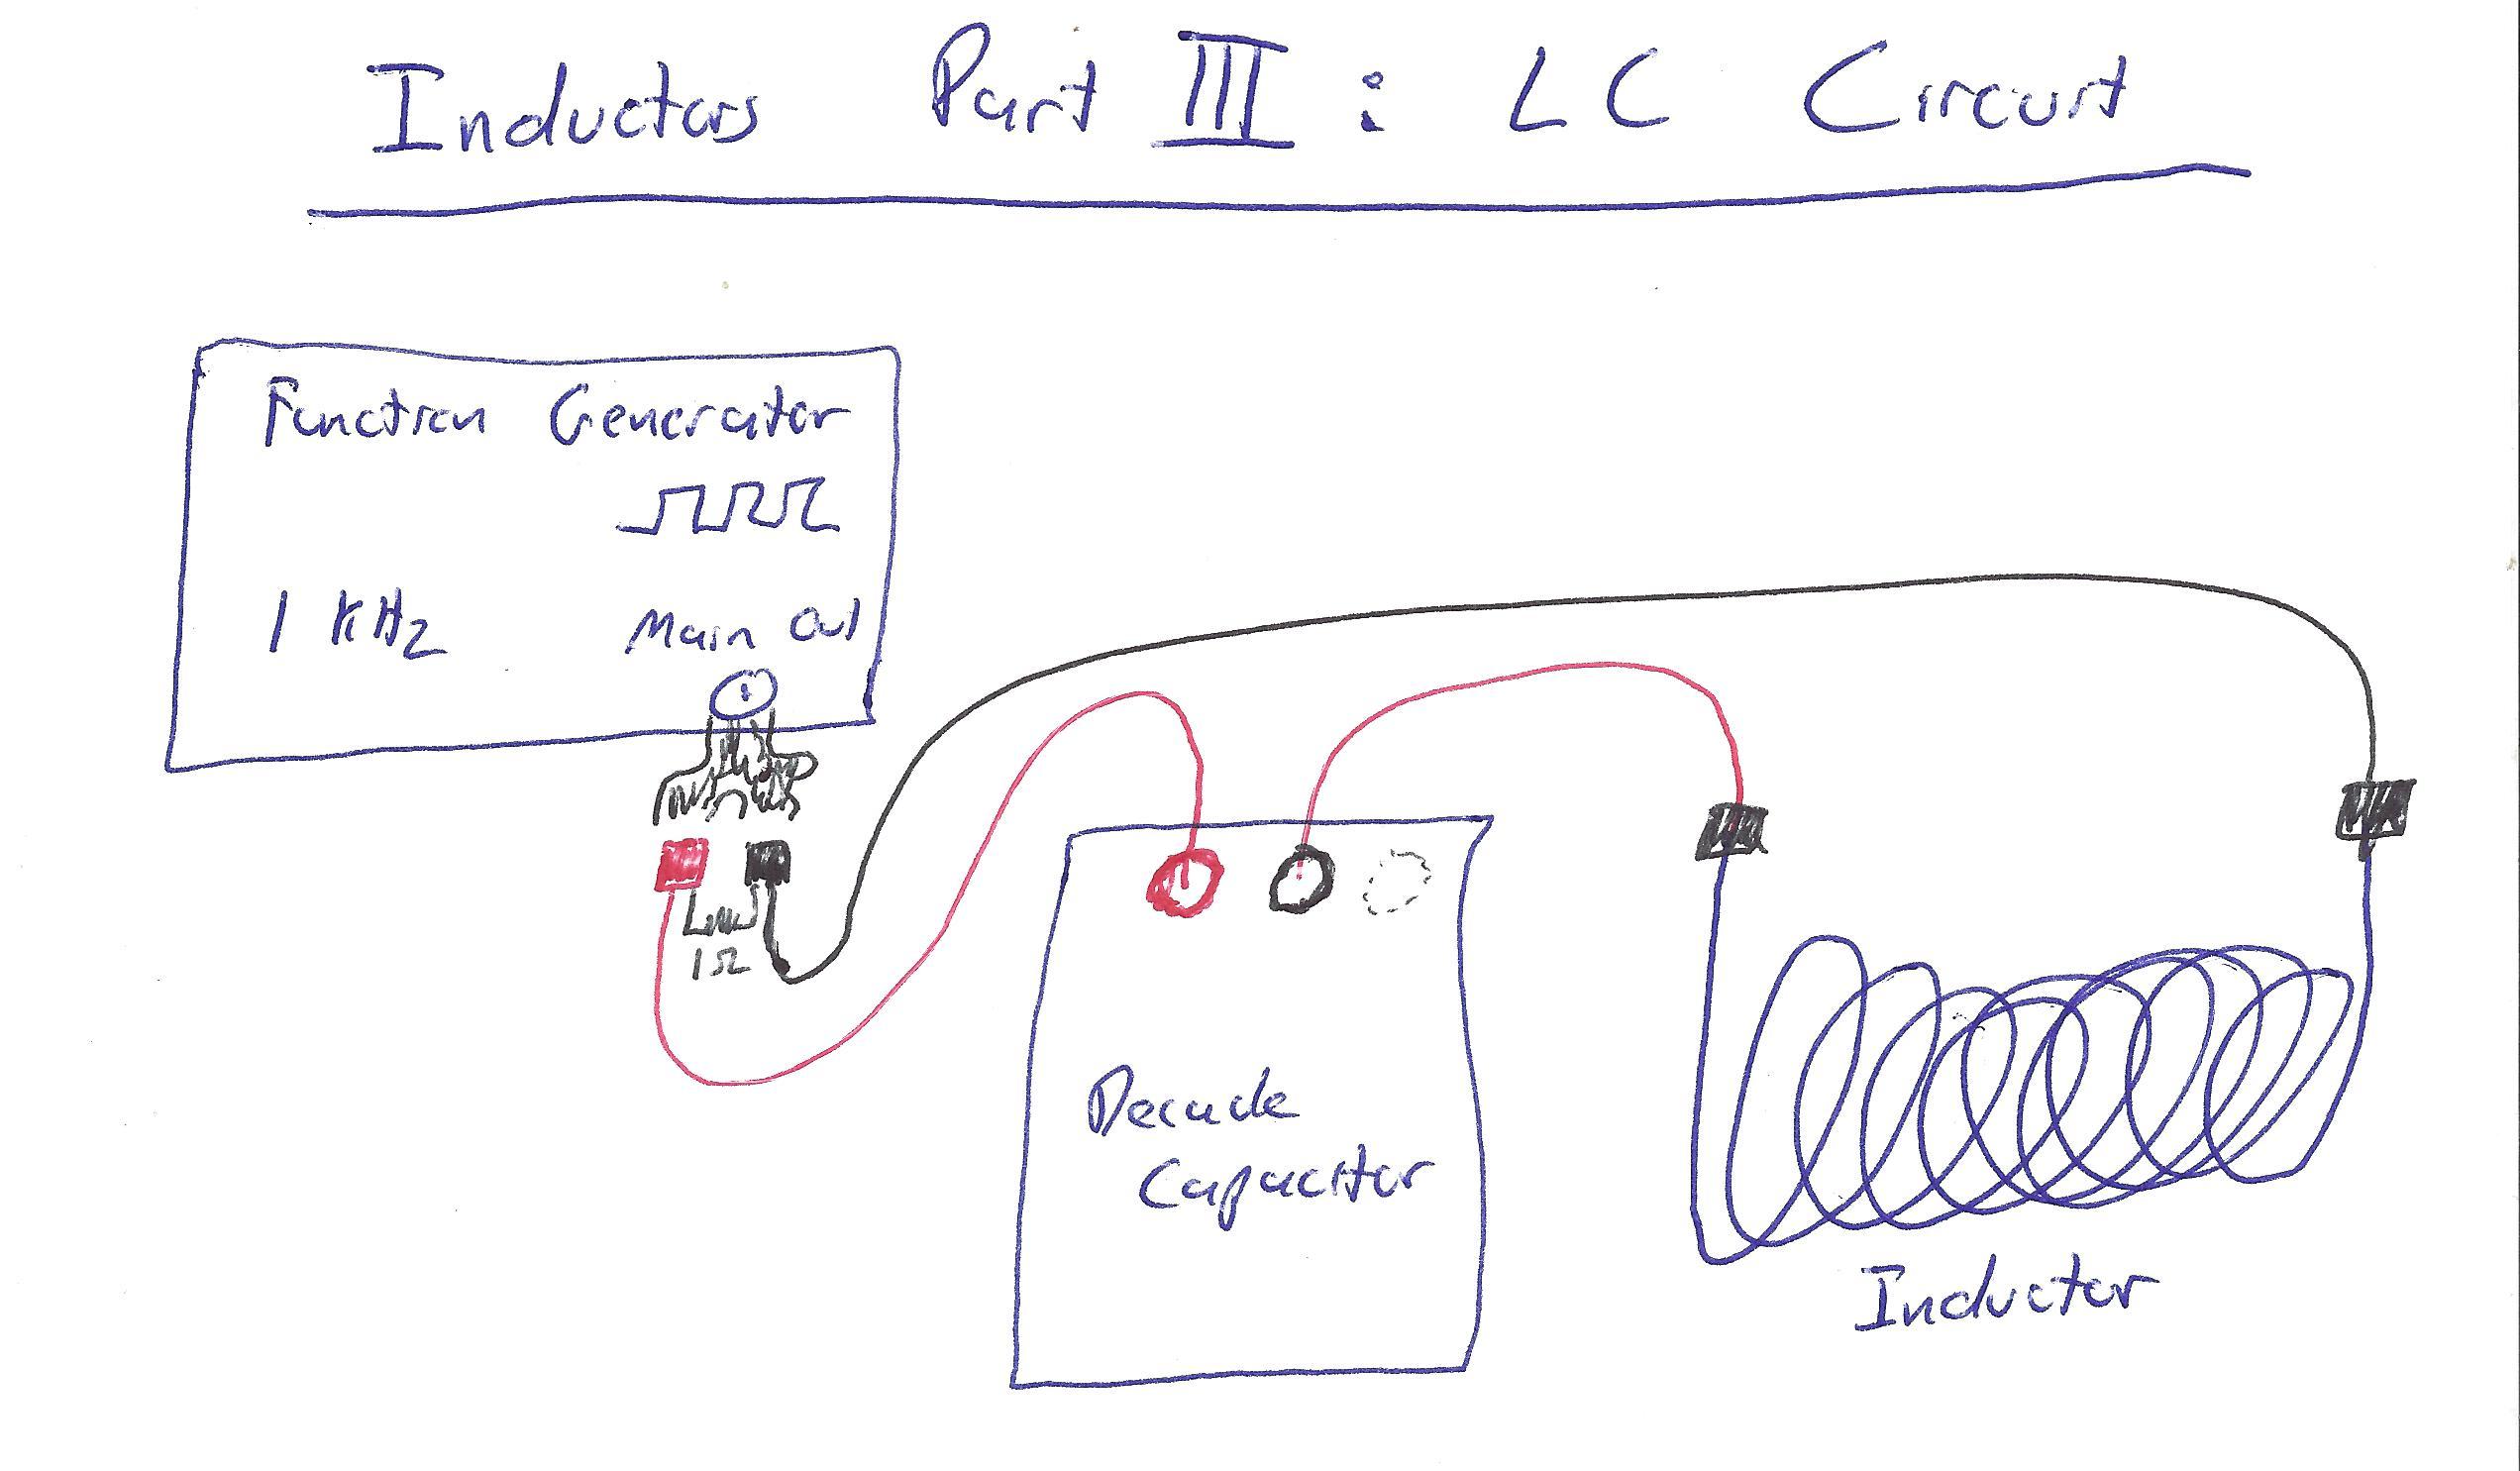
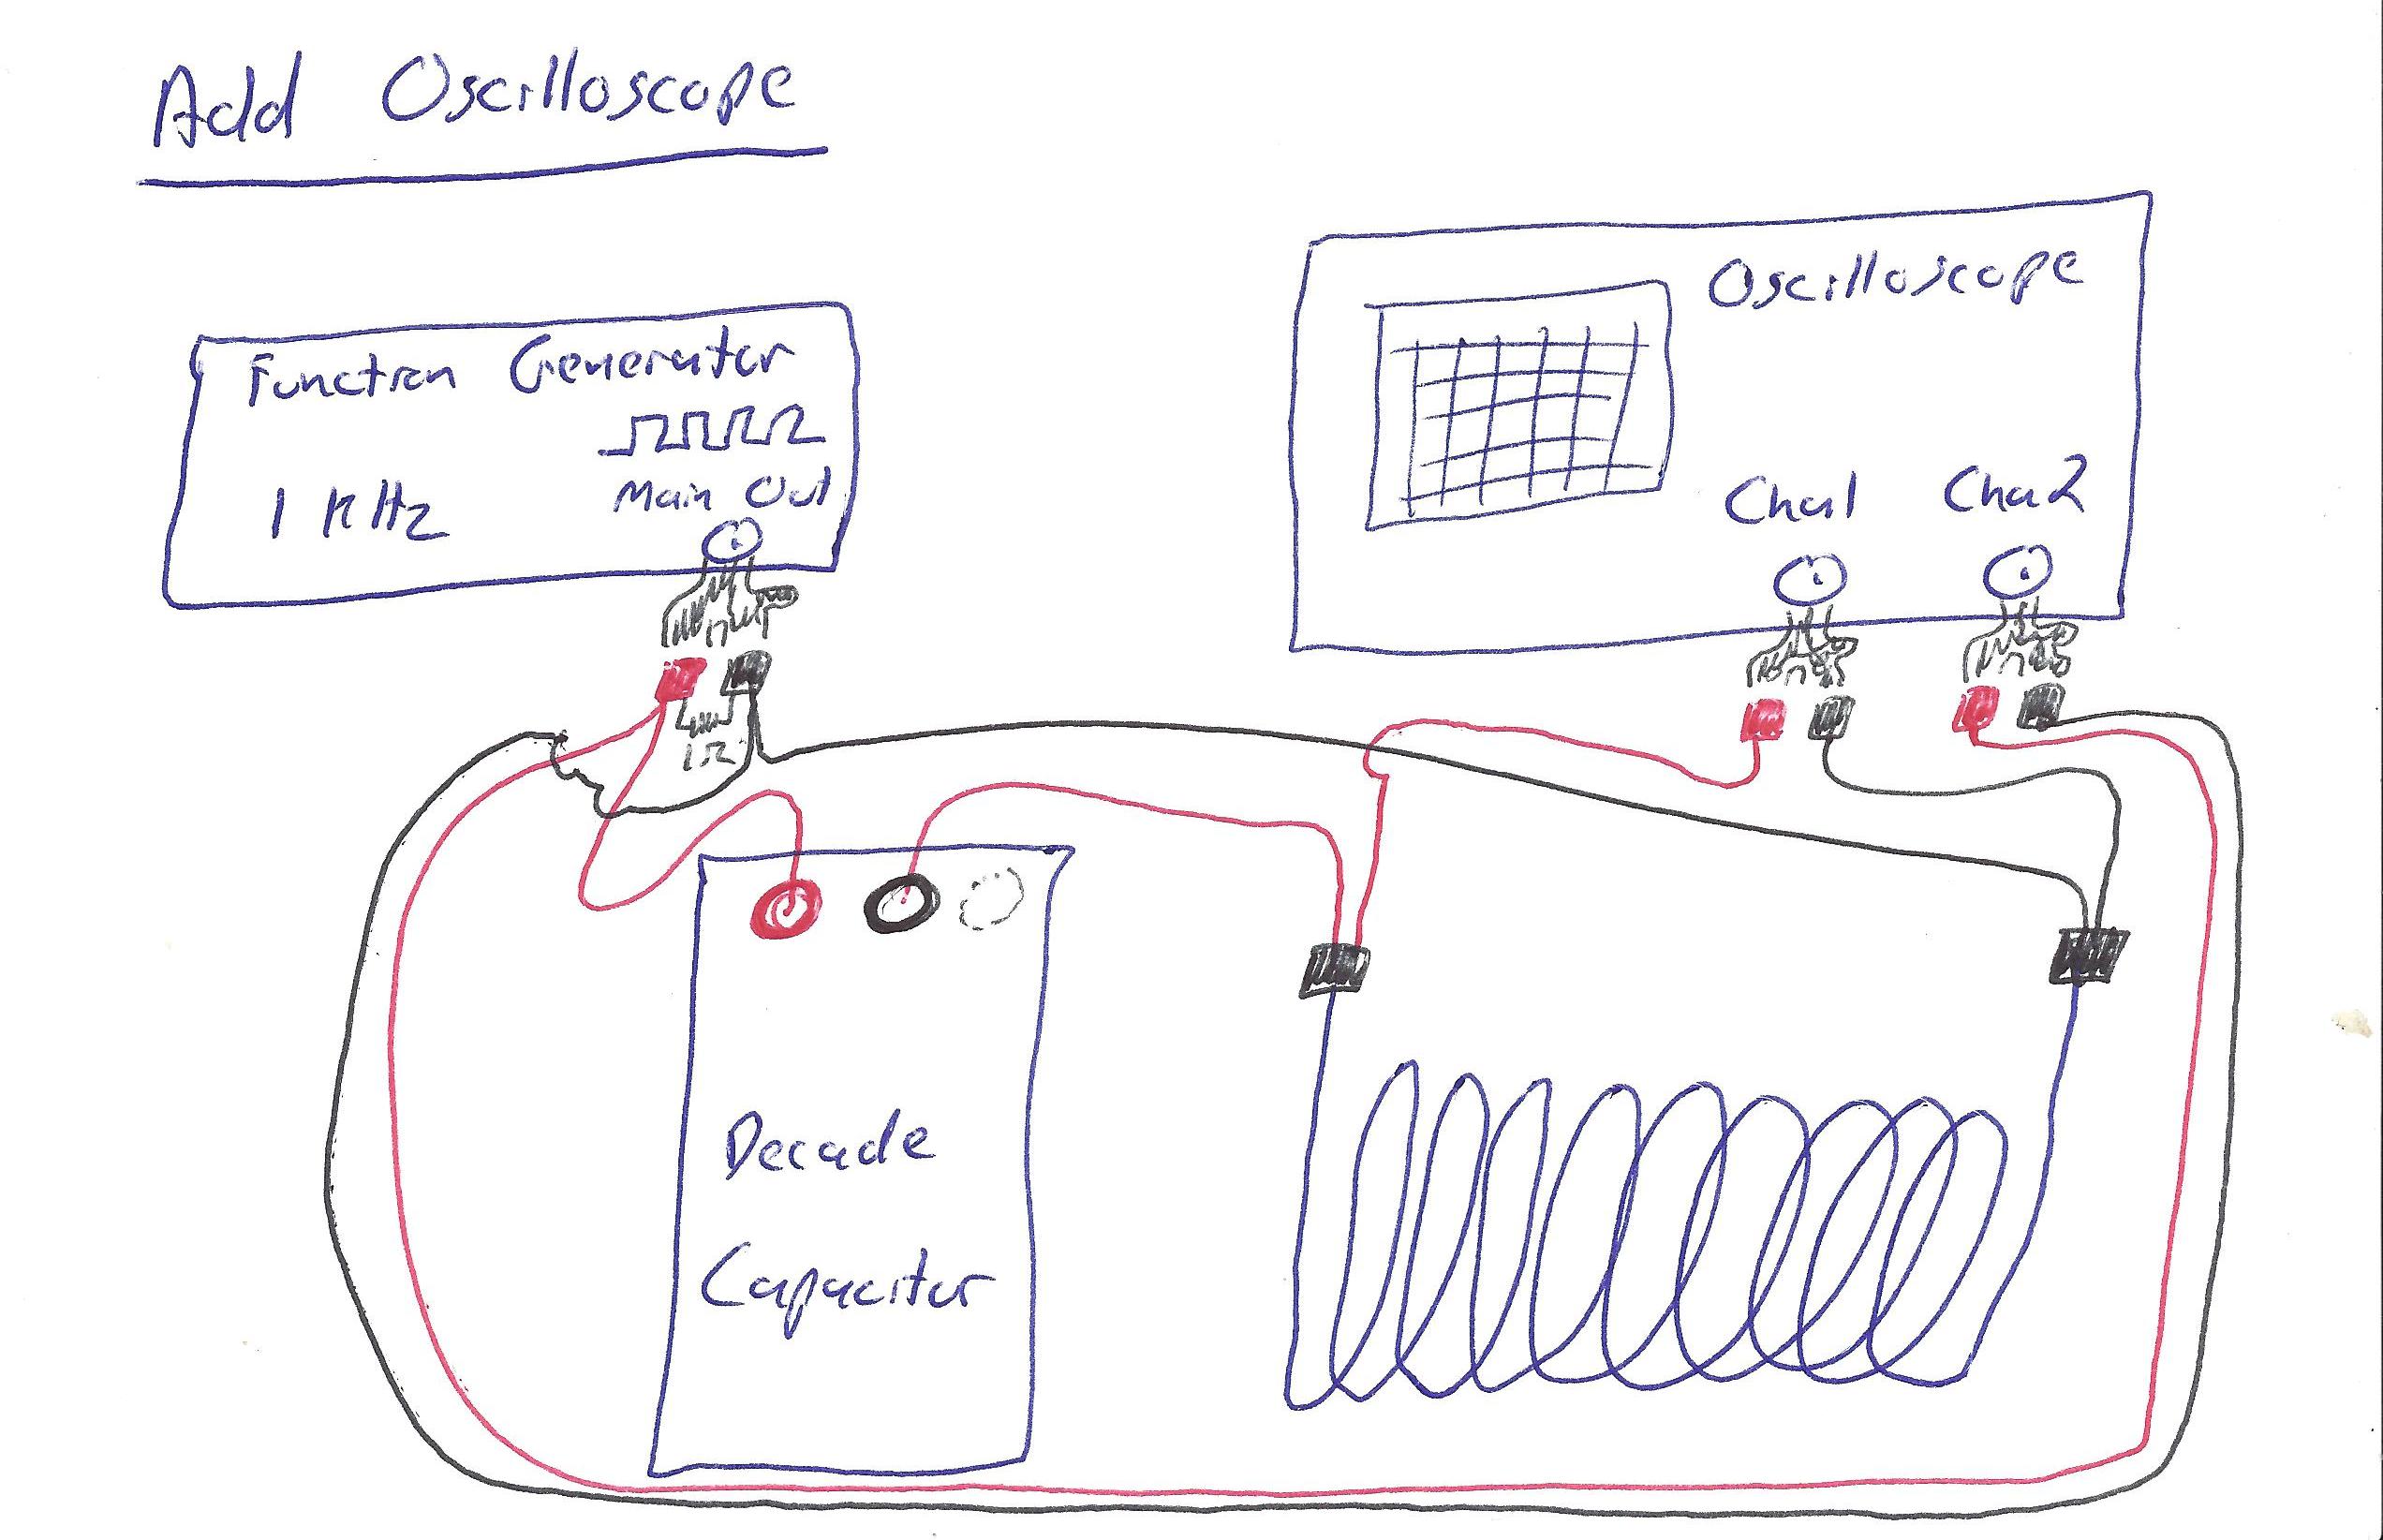
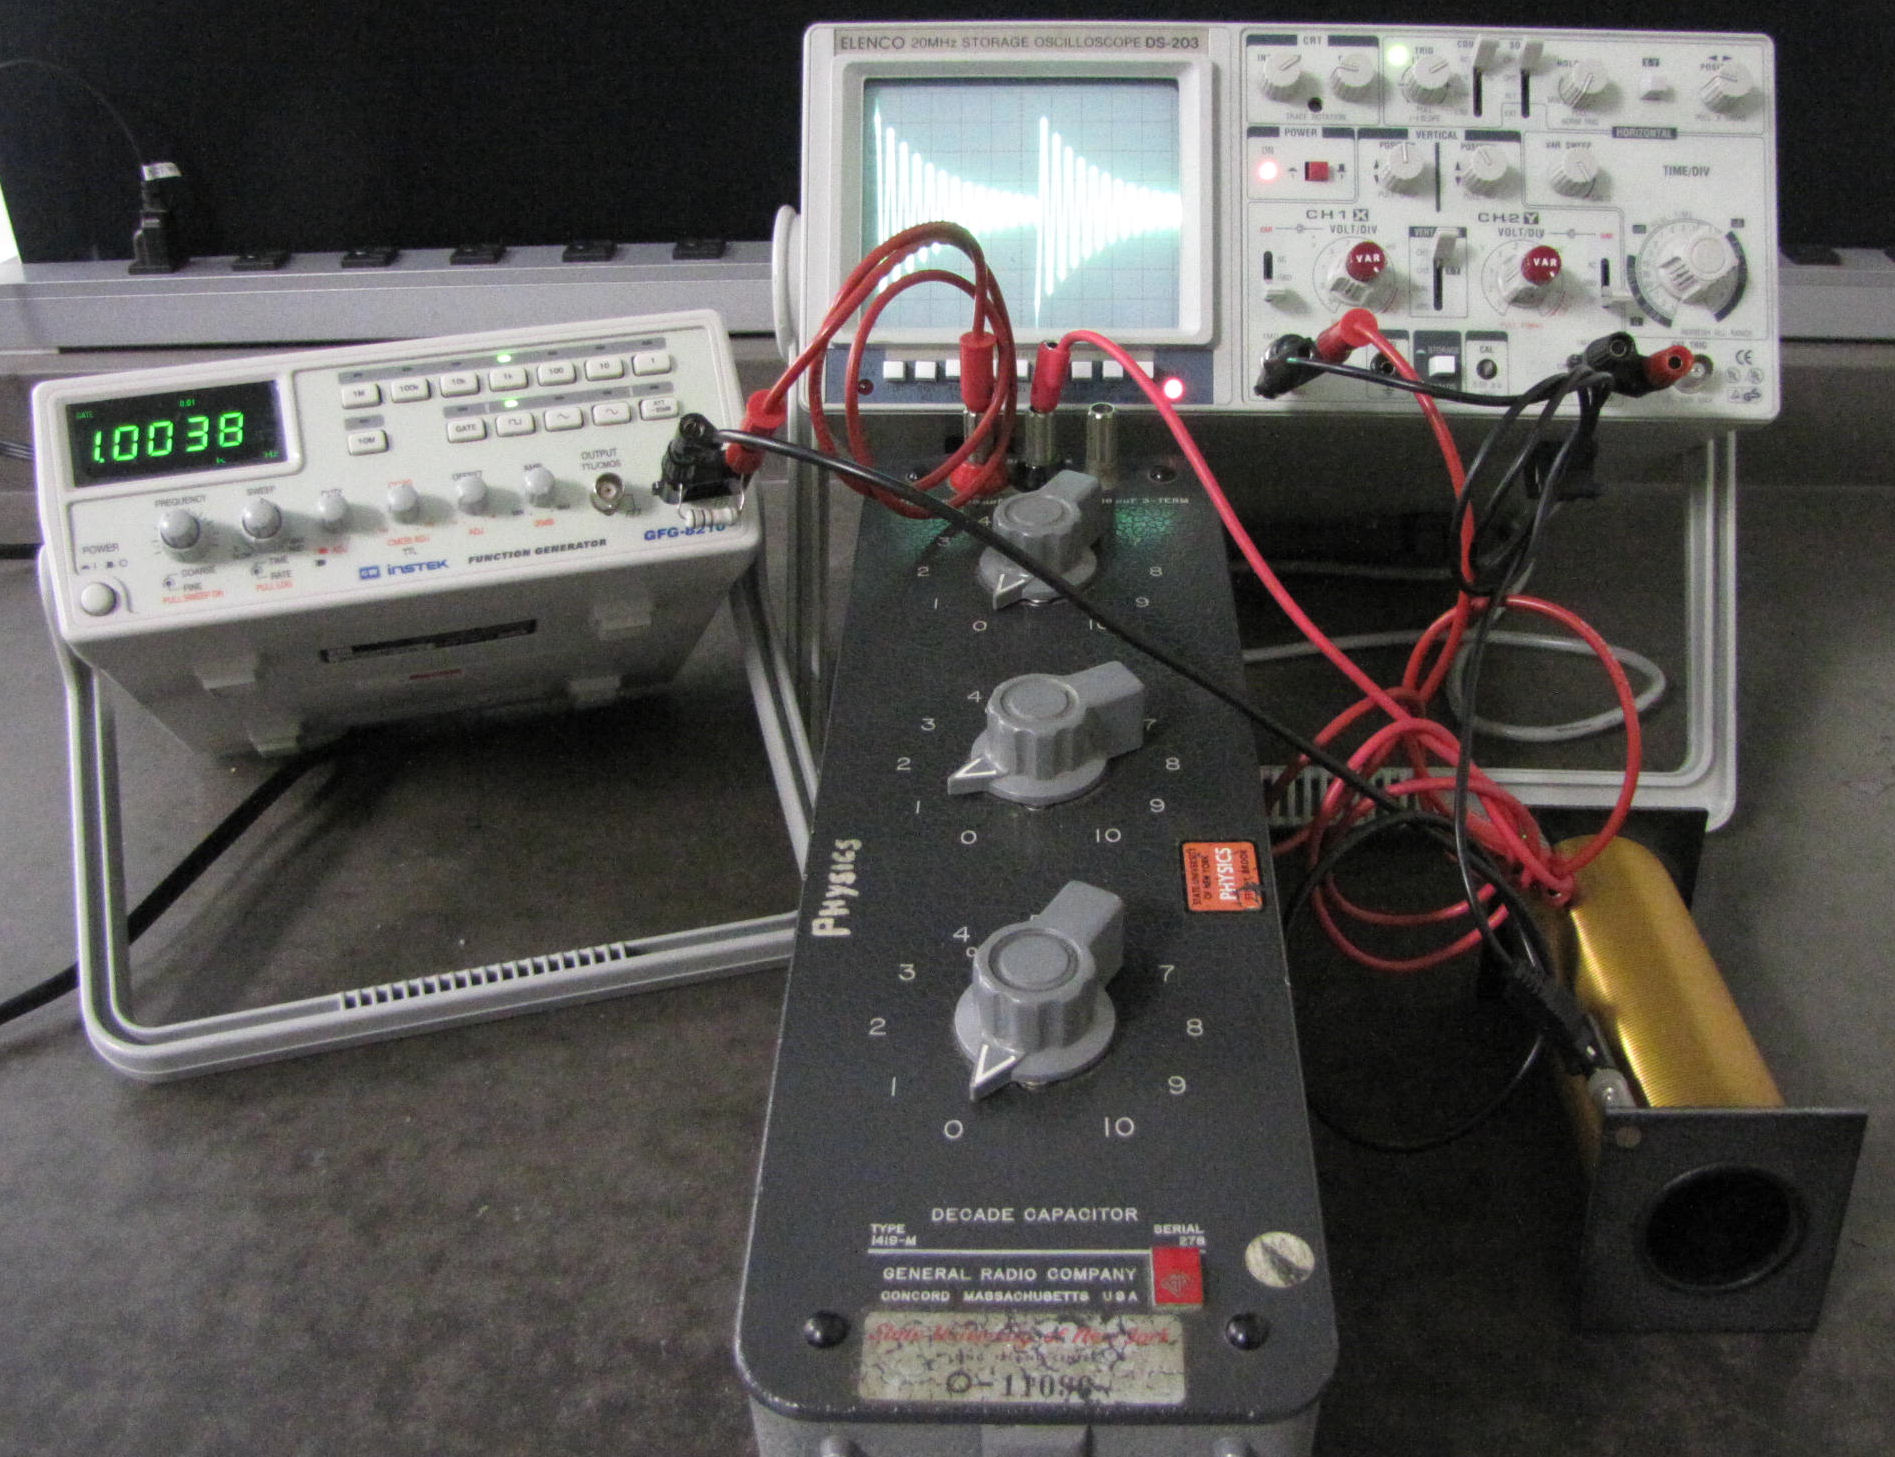
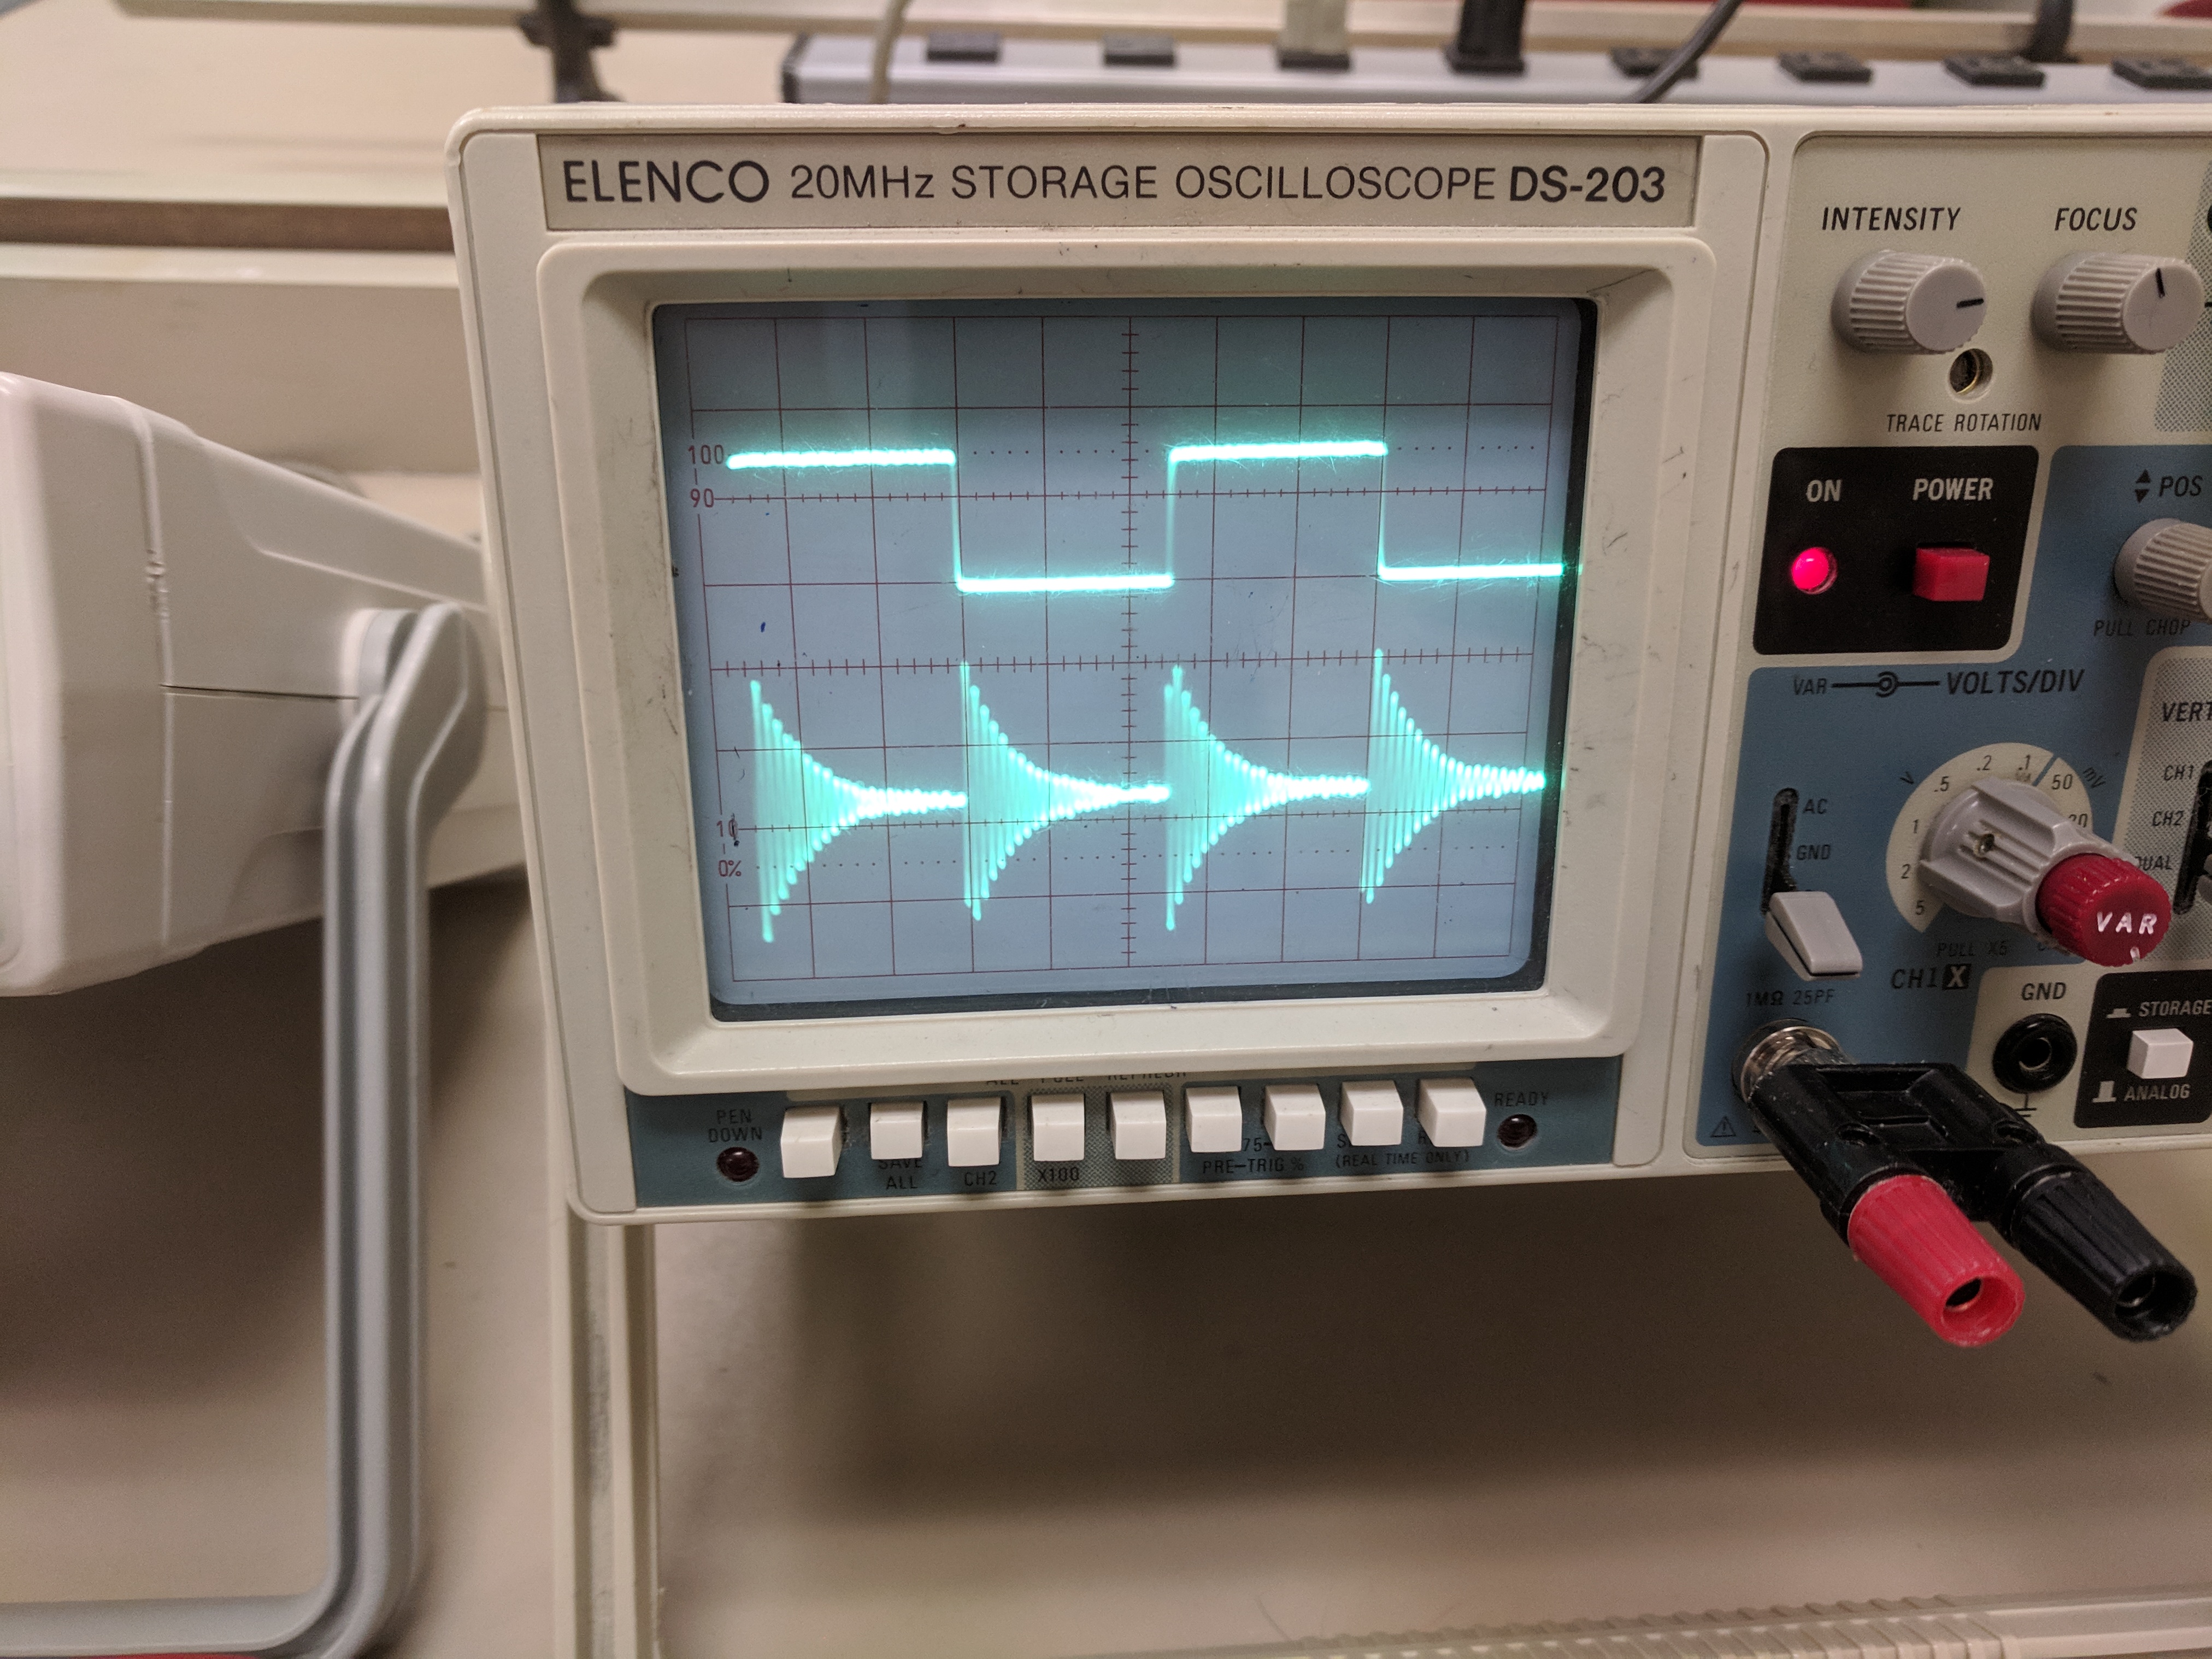
Set your capacitor to 0.002μF. Keep your function generator outputting a 1kHz square wave.
Click here for reasonable starting oscilloscope settings.
The following knobs must be set as listed:
- POWER: Pushed in (duh)
- VAR knobs and VAR SWEEP: calibrated (most clockwise) position
- SOURCE: CH2 (we want to trigger on the square wave for a more reliable input)
- VERT MODE: DUAL (initially; you can swap to CH1 or CH2 if desired)
- COUPLING: AC
- AC GND DC (both channels): Set to DC
- XY, STORAGE/ANALOG, all buttons in bottom-left: pushed out
The following settings are a suggested starting place to get a reasonable picture, but you can more-or-less tweak these freely:
- TRIGGER LEVEL: middle position, pushed in
- INTENSITY, FOCUS: middle position
- POS knobs (both channels and time): middle position
- VOLTS/DIV: 50mV (will vary depending on amplitude setting chosen)
- TIME/DIV: 0.2ms
If those are set as such, your oscilloscope is plugged in, and you're still not seeing something reasonable, consult your TA.
Measure the length of time the circuit takes to oscillate some number of times (~10), and note how many oscillations you counted.
Now, change your capacitor to 0.006μF. Repeat the measurements with this new capacitance.
Part I: Theoretical Value for \(L\)
Use your physical measurements to estimate the L of your solenoid with an uncertainty.
Part II: LR Circuits
For each \(R\) value:
- Make a plot of \(\ln(V)\) vs. \(t\). Treat your y-axis as unitless for this purpose, and allow an intercept.
- From your slope, extract a measurement of \(\tau\), and from that, \(L\).
- Propagate uncertainties.
Answer the question on the data sheet about whether your results agree with expectation.
Part III: LC Circuits
For each \(C\) value:
- Calculate \(T\) from the time and number of oscillations.
- From \(T\), calculate \(\omega_0\), and from that, \(L\). Keep in mind that \(\omega_0\) is not the same thing as \(f_0\).
- Propagate uncertainties.
Answer the question on the data sheet about whether your results agree with expectation.
Your TA will ask you to discuss some of the following topics (they will tell you which ones):
- Deriving Equations: Explain why (using Kirchoff's rules) equations \eqref{LReq} and \eqref{LCeq} are true equations for LR and LC circuits, respectively.
- Validating Solutions: Let's show that equations \eqref{LRsol} and \eqref{LCsol} are actually the behavior we expect for these circuits (assuming the differential equations \eqref{LReq} and \eqref{LCeq} hold). Note that we're not actually deriving these formulas, just showing that they do work (i.e., that they solve the differential equation like we want them to).5 This has the following steps:
- Differential Equation, LR Circuits: Take \eqref{LRsol}, and plug it into \eqref{LReq} (taking a derivative where necessary). Do the algebra to show that you get the same thing on both sides.
- Differential Equation, LC Circuits: Take \eqref{LCsol}, and plug it into \eqref{LCeq} (taking derivatives where necessary). Do the algebra to show that you get the same thing on both sides.
- Initial Conditions, LR Circuits: Take \eqref{LRsol}, and plug in \(t=0\). Show that you get the same thing on both sides (i.e., \(I(0)=I(0)\)).
- Initial Conditions, LR Circuits: Take \eqref{LCsol}, and plug in \(t=0\). Show that you get the same thing on both sides (i.e., \(Q(0)=Q(0)\)). Also, take a derivative of \eqref{LCsol} w.r.t. time, then plug in \(t=0\) and show that both sides are consistent (i.e., you get \(Q'(0)=Q'(0)\)).
- Units on \(\ln(V)\): Consider the units on the y-axis of our LR circuits plot. We're taking the logarithm of a quantity with units, which doesn't seem to make sense (how would we determine the units on the output quantity? That's a rhetorical question; don't answer it). Consider what a change of units does to \(\ln(V)\). Why does this not matter from the perspective of the plot we make (and the measurements we make on it), provided all voltages are measured in the same units?
- Deviations between \(\omega_d\) and \(\omega_0\): Assuming the resistance in the LC circuit is 2Ω and using (one of) your (sets of) measurements from part III, calculate the size of \(\frac{R}{L}\) compared to \(\omega_0\). Is our approximation that \(\omega_d\simeq\omega_0\) justifed?
- Choice of Measurement Point for Period: In Part III, we chose to measure the time difference between two different waves. There are some subtleties to consider here, though, because of the resistance: our curve isn't actually exactly periodic; there's some damping.
- Where are the zeroes of a damped sine wave? Would we expect a hypothetical \(t\) vs. \(n\) plot to be linear for a damped sine wave? (The damped sine wave is of the form \(f(t)=e^{-\alpha t}\sin(\omega t)\).)
- What if, instead of using the zeroes, we used the maxima and minima? Where are those located?4 You may find helpful here the following trigonometric identity: $$A\cos(\theta)+B\sin(\theta)=\sqrt{A^2+B^2}\sin\left(\theta+\tan^{-1}\left(\frac{A}{B}\right)\right)$$
- Could we use both the zeroes and the maxima/minima at the same time? Why or why not?
- Systemic Error: Effects of Resistance:
- Part II: We pretend we are measuring purely across an inductor, but really we are also measuring across a small fraction of the total resistance of the circuit, too. What is the impact of this, if any, on the shape of the curve and the final measurements we make? (A sketch that exaggerates the impact of the resistance of the inductor may be useful.)
- Part III: (See the "LRC Circuits" part in the "Background" section above.) Using the exact formula for \(\omega_d\), what is the qualitative impact of the resistance? (Would our measurement of \(L\) be too high or too low, as compared with part I?)
- Part III (extra; hard): The resistance in this part is primarily in our inductor, meaning it's a part of the voltage the oscilloscope measures. What is the impact of this (if any) on the shape of the curve we observe? (Again, a sketch that exaggerates this effect may be helpful here.)
Hovering over these bubbles will make a footnote pop up. Gray footnotes are citations and links to outside references.
Blue footnotes are discussions of general physics material that would break up the flow of explanation to include directly. These can be important subtleties, advanced material, historical asides, hints for questions, etc.
Yellow footnotes are details about experimental procedure or analysis. These can be reminders about how to use equipment, explanations of how to get good results, troubleshooting tips, or clarifications on details of frequent confusion.
For details on the calulation of L for a solenoid, see Katz Chapter 33.1, example 33.1 or Giancoli Chapter 30.2, example 30.3.
For a review of LR circuits, see Katz Chapter 33-3 or Giancoli Chapter 30-4.
For a review of LC circuits, see Katz Chapter (...) or Giancoli Chapter (...).
For a review of LRC circuits, see Katz Chapter 33-9 or Giancoli Chapter 30-6 to 30-8.
For an overview of the overdamped and critically damped cases in the analogous case of a mechanical oscillator, see Katz Chapter 16.10-11 or Giancoli Chapter 14.7-8.
See our Function Generator Reference Document for more detail.
The square wave will technically change our initial conditions \(I(0)\) and \(Q(0)\) (as well as the equilibrium charge \(CV_0\) across our capacitor, which we would see if that's what we were measuring voltage across) but not the frequency \(\omega_0\), which is what we will be interested in measuring.
Formally, we require that \(\frac{R}{L}<\frac{1}{\sqrt{LC}}\), or equivalently that \(\alpha<\omega_0\). This is known as the underdamped case.
You'll note that when \(\alpha\) becomes too large, this frequency becomes imaginary (or zero). This is the issue of the "smallness" of \(\alpha\) being required for our solution to work. (Technically, if you bring in sufficiently much power of complex numbers, it still works, but you need some extra work to understand what it means "physically," and that work is easier if you just write the solution differently to begin with, so that's what we do.)
If you Taylor-expand this in \(\alpha\), you'll find that the exponential decay contributes to \(Q(t)\) to first order in \(\alpha\), whereas the correction to frequency only contributes to second order. This partially explains why, even though we see the exponential decay, we are justified in ignoring it in our calculation of the frequency.
Actually, when you take a course on differential equations, you'll find that the actual methods used to "derive solutions" aren't much better than the sort of "guess-and-check" methods that we use here (more properly called making an ansatz). There are some technicalities to show that once you find a solution, it is the solution (i.e., that solutions are unique - unlike, say, the equation \(x^2=1\), which has two solutions, \(x=\pm 1\)), but otherwise, for the most part, solving differential equations is really just about making good guesses.
You'll have to give some thought about how best to measure these parameters. Remember that what we care about is the configuration of the wires, not the dimensions of the frame.
A warning: do not be clever here, and think that the order of components does not matter. Both the oscilloscope and function generator have their black terminals wired to ground - i.e., they are all implicitly connected together (through the ground terminals in the outlet). Therefore, if you rearrange things, you may just put a "ground" in the middle of your circuit, which (as you might imagine) will throw everything off!
In addition to the things you are expected to wire up yourself, there should be a 1Ω resistor wired directly across the ports of the function generator. The purpose of this is to make the function generator reliably output a square wave; don't worry about the details for now. If you don't have this resistor, don't worry, unless your square wave is very much not square (e.g., it "spikes" above the square wave whenever it switches).
Hint: this isn't immediately obvious. Take a derivative of \(f\) to find the maxima/minima explicitly; are they periodic in time?